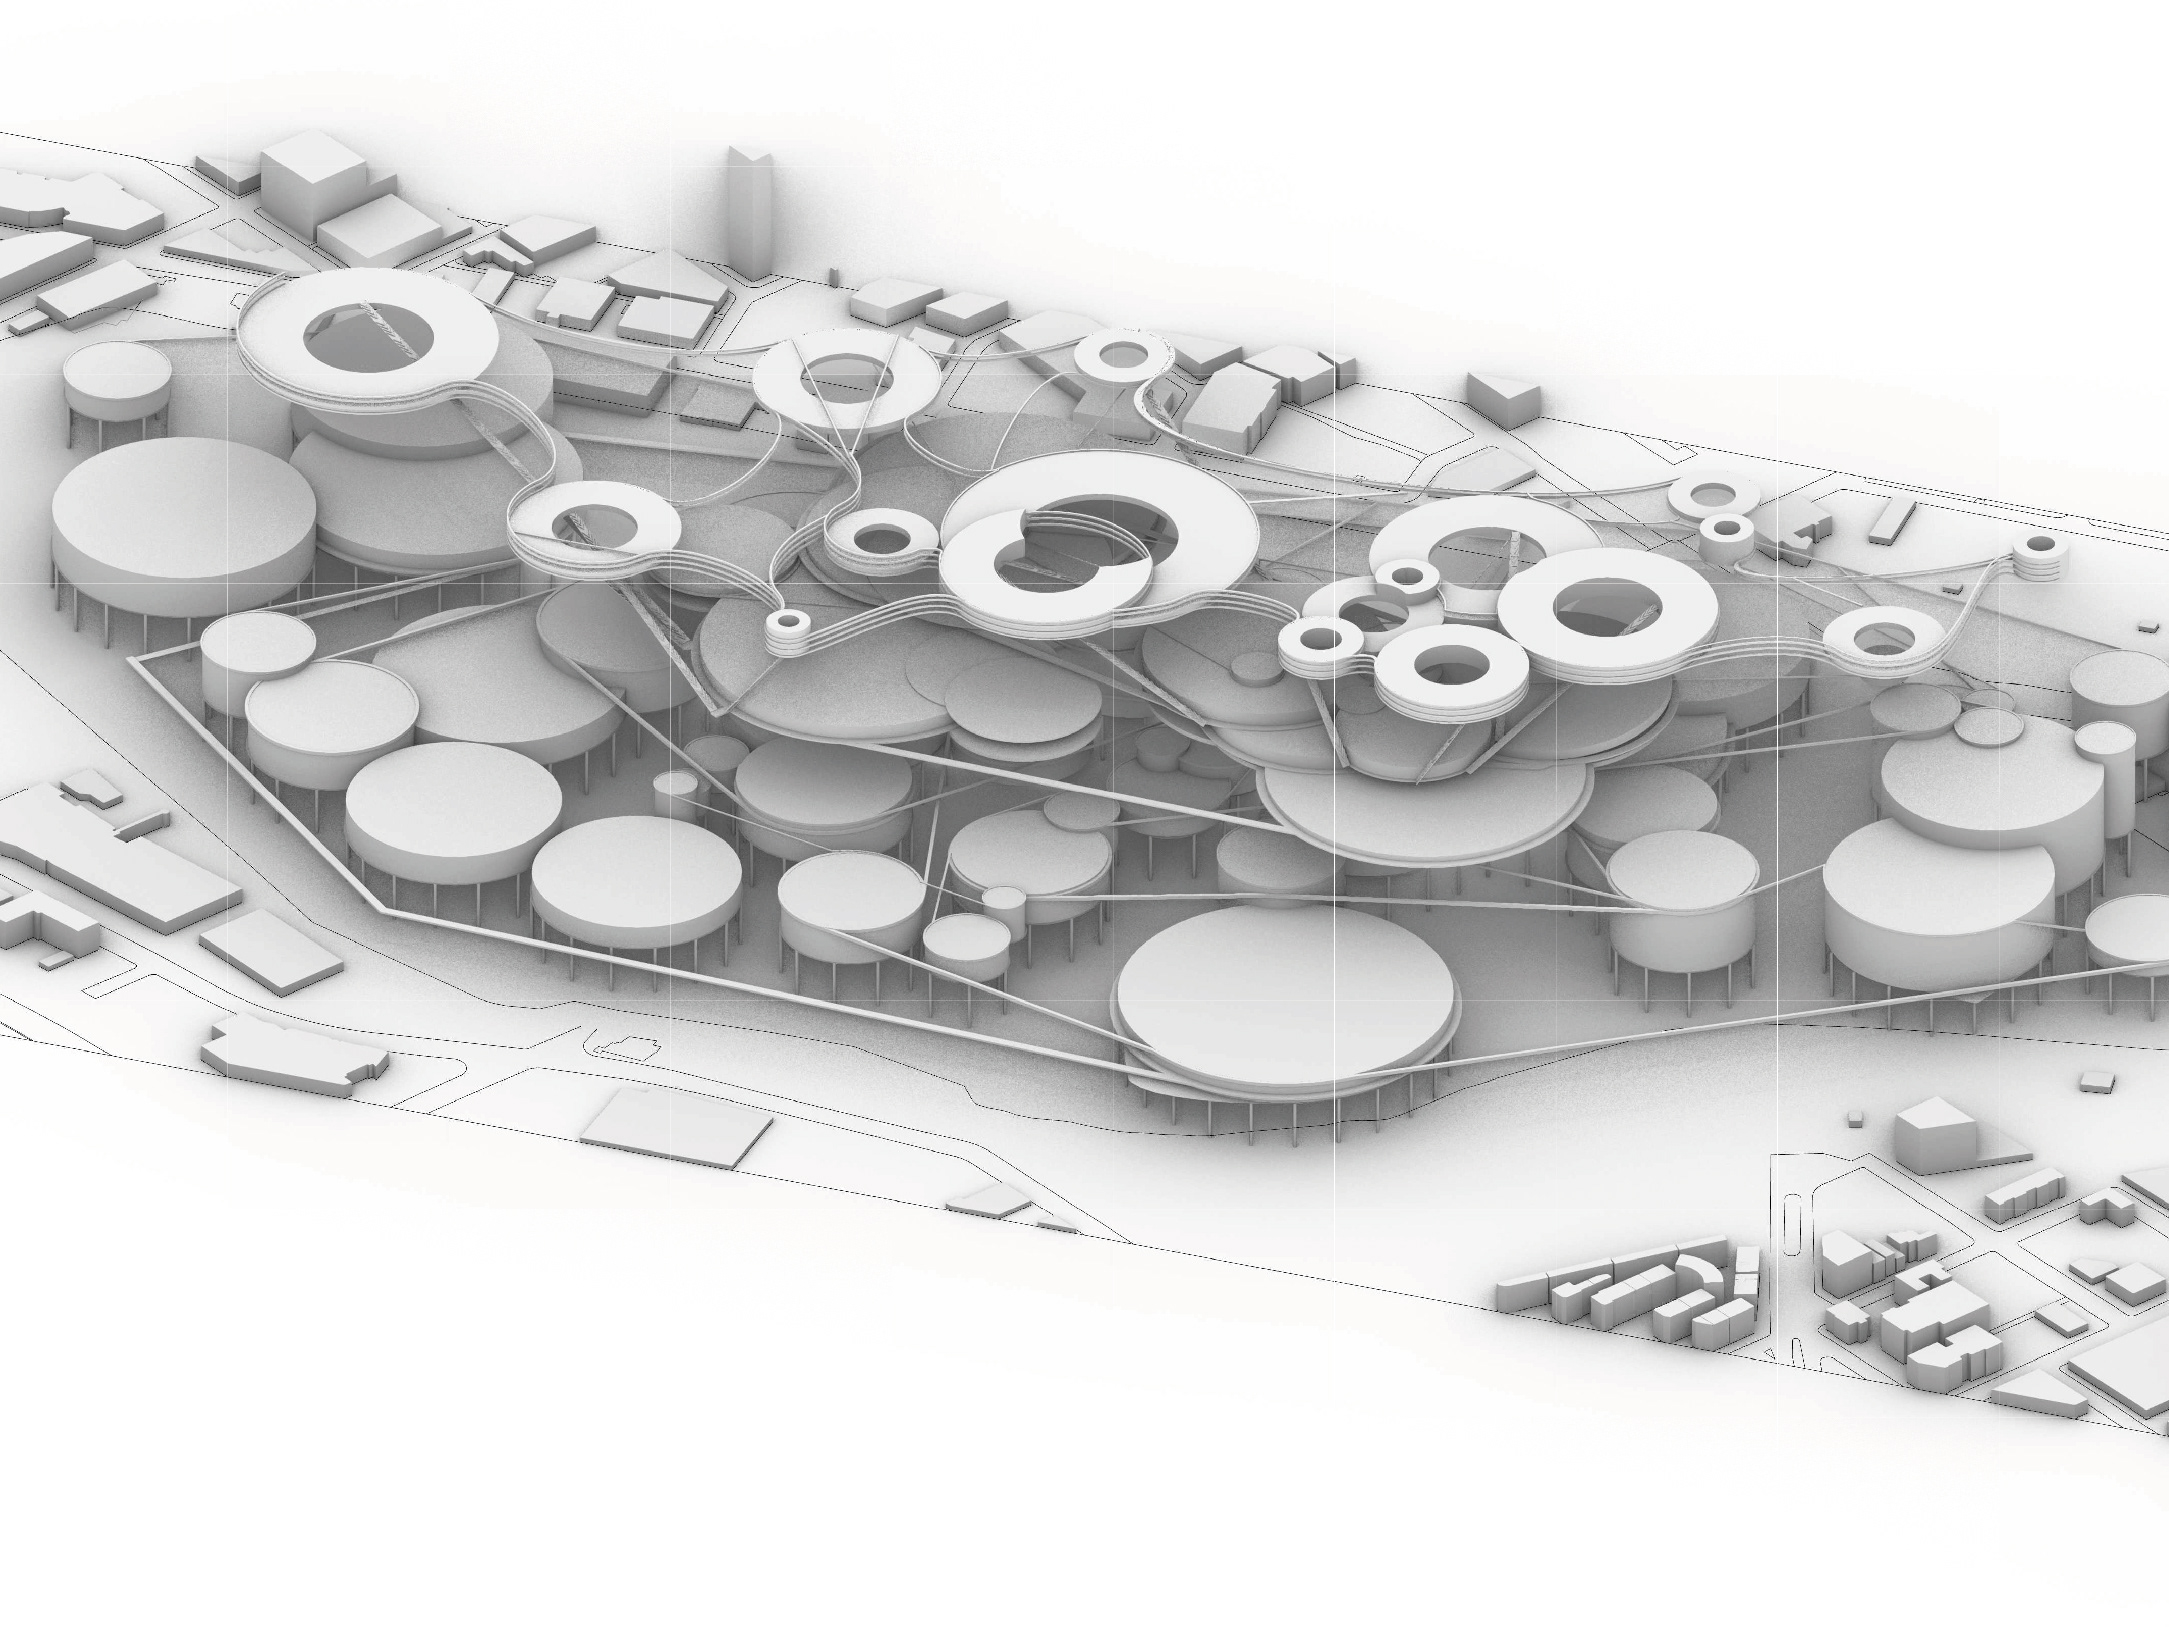
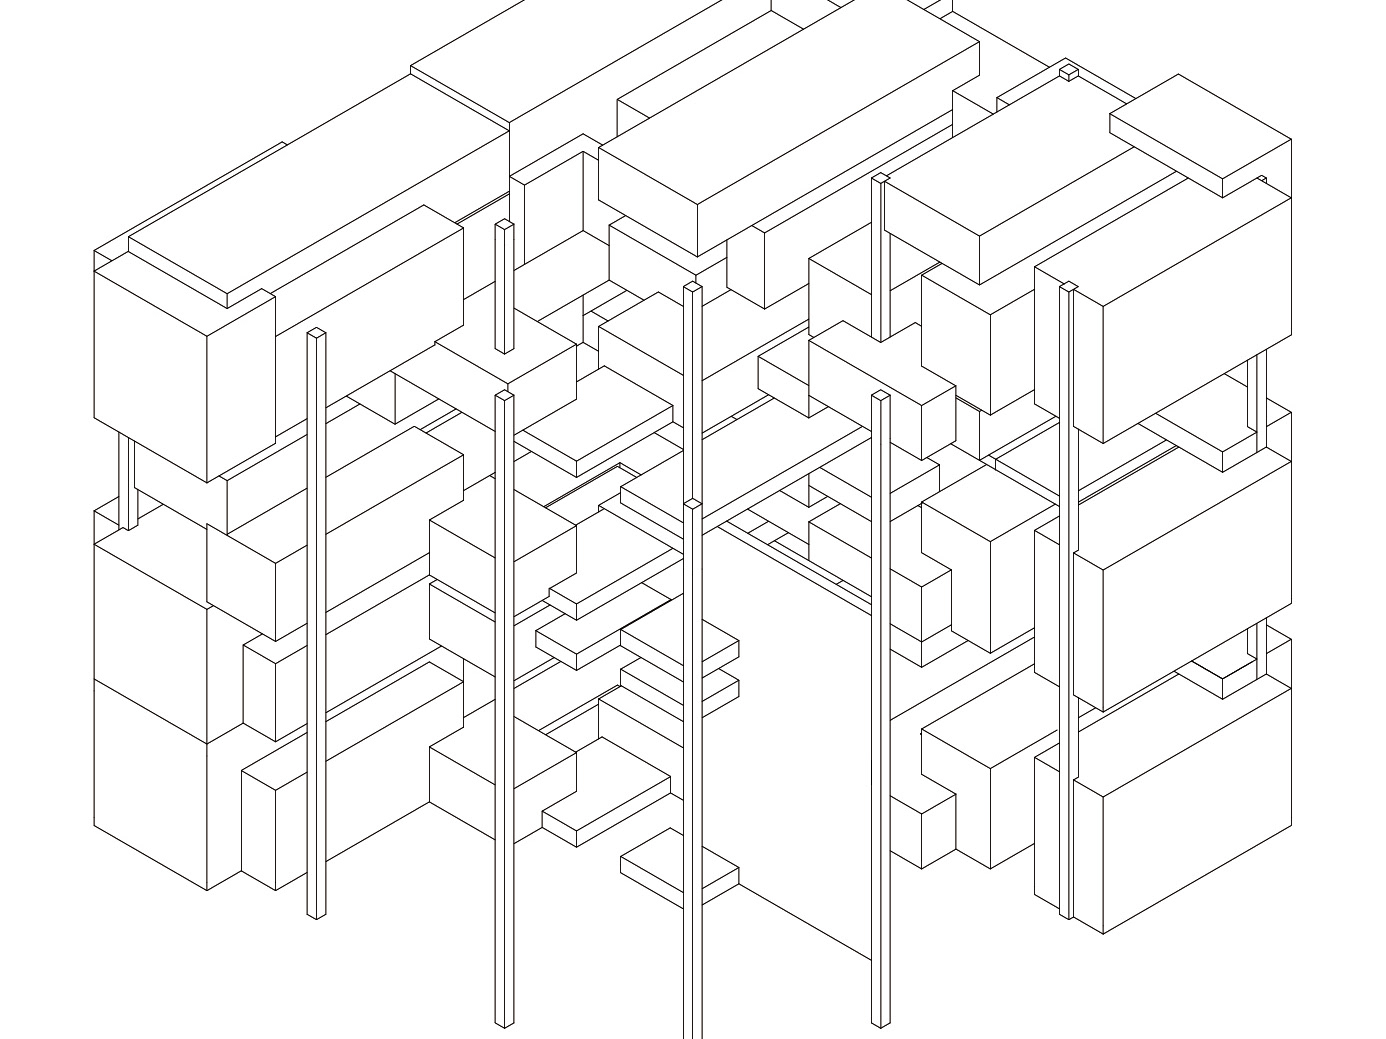
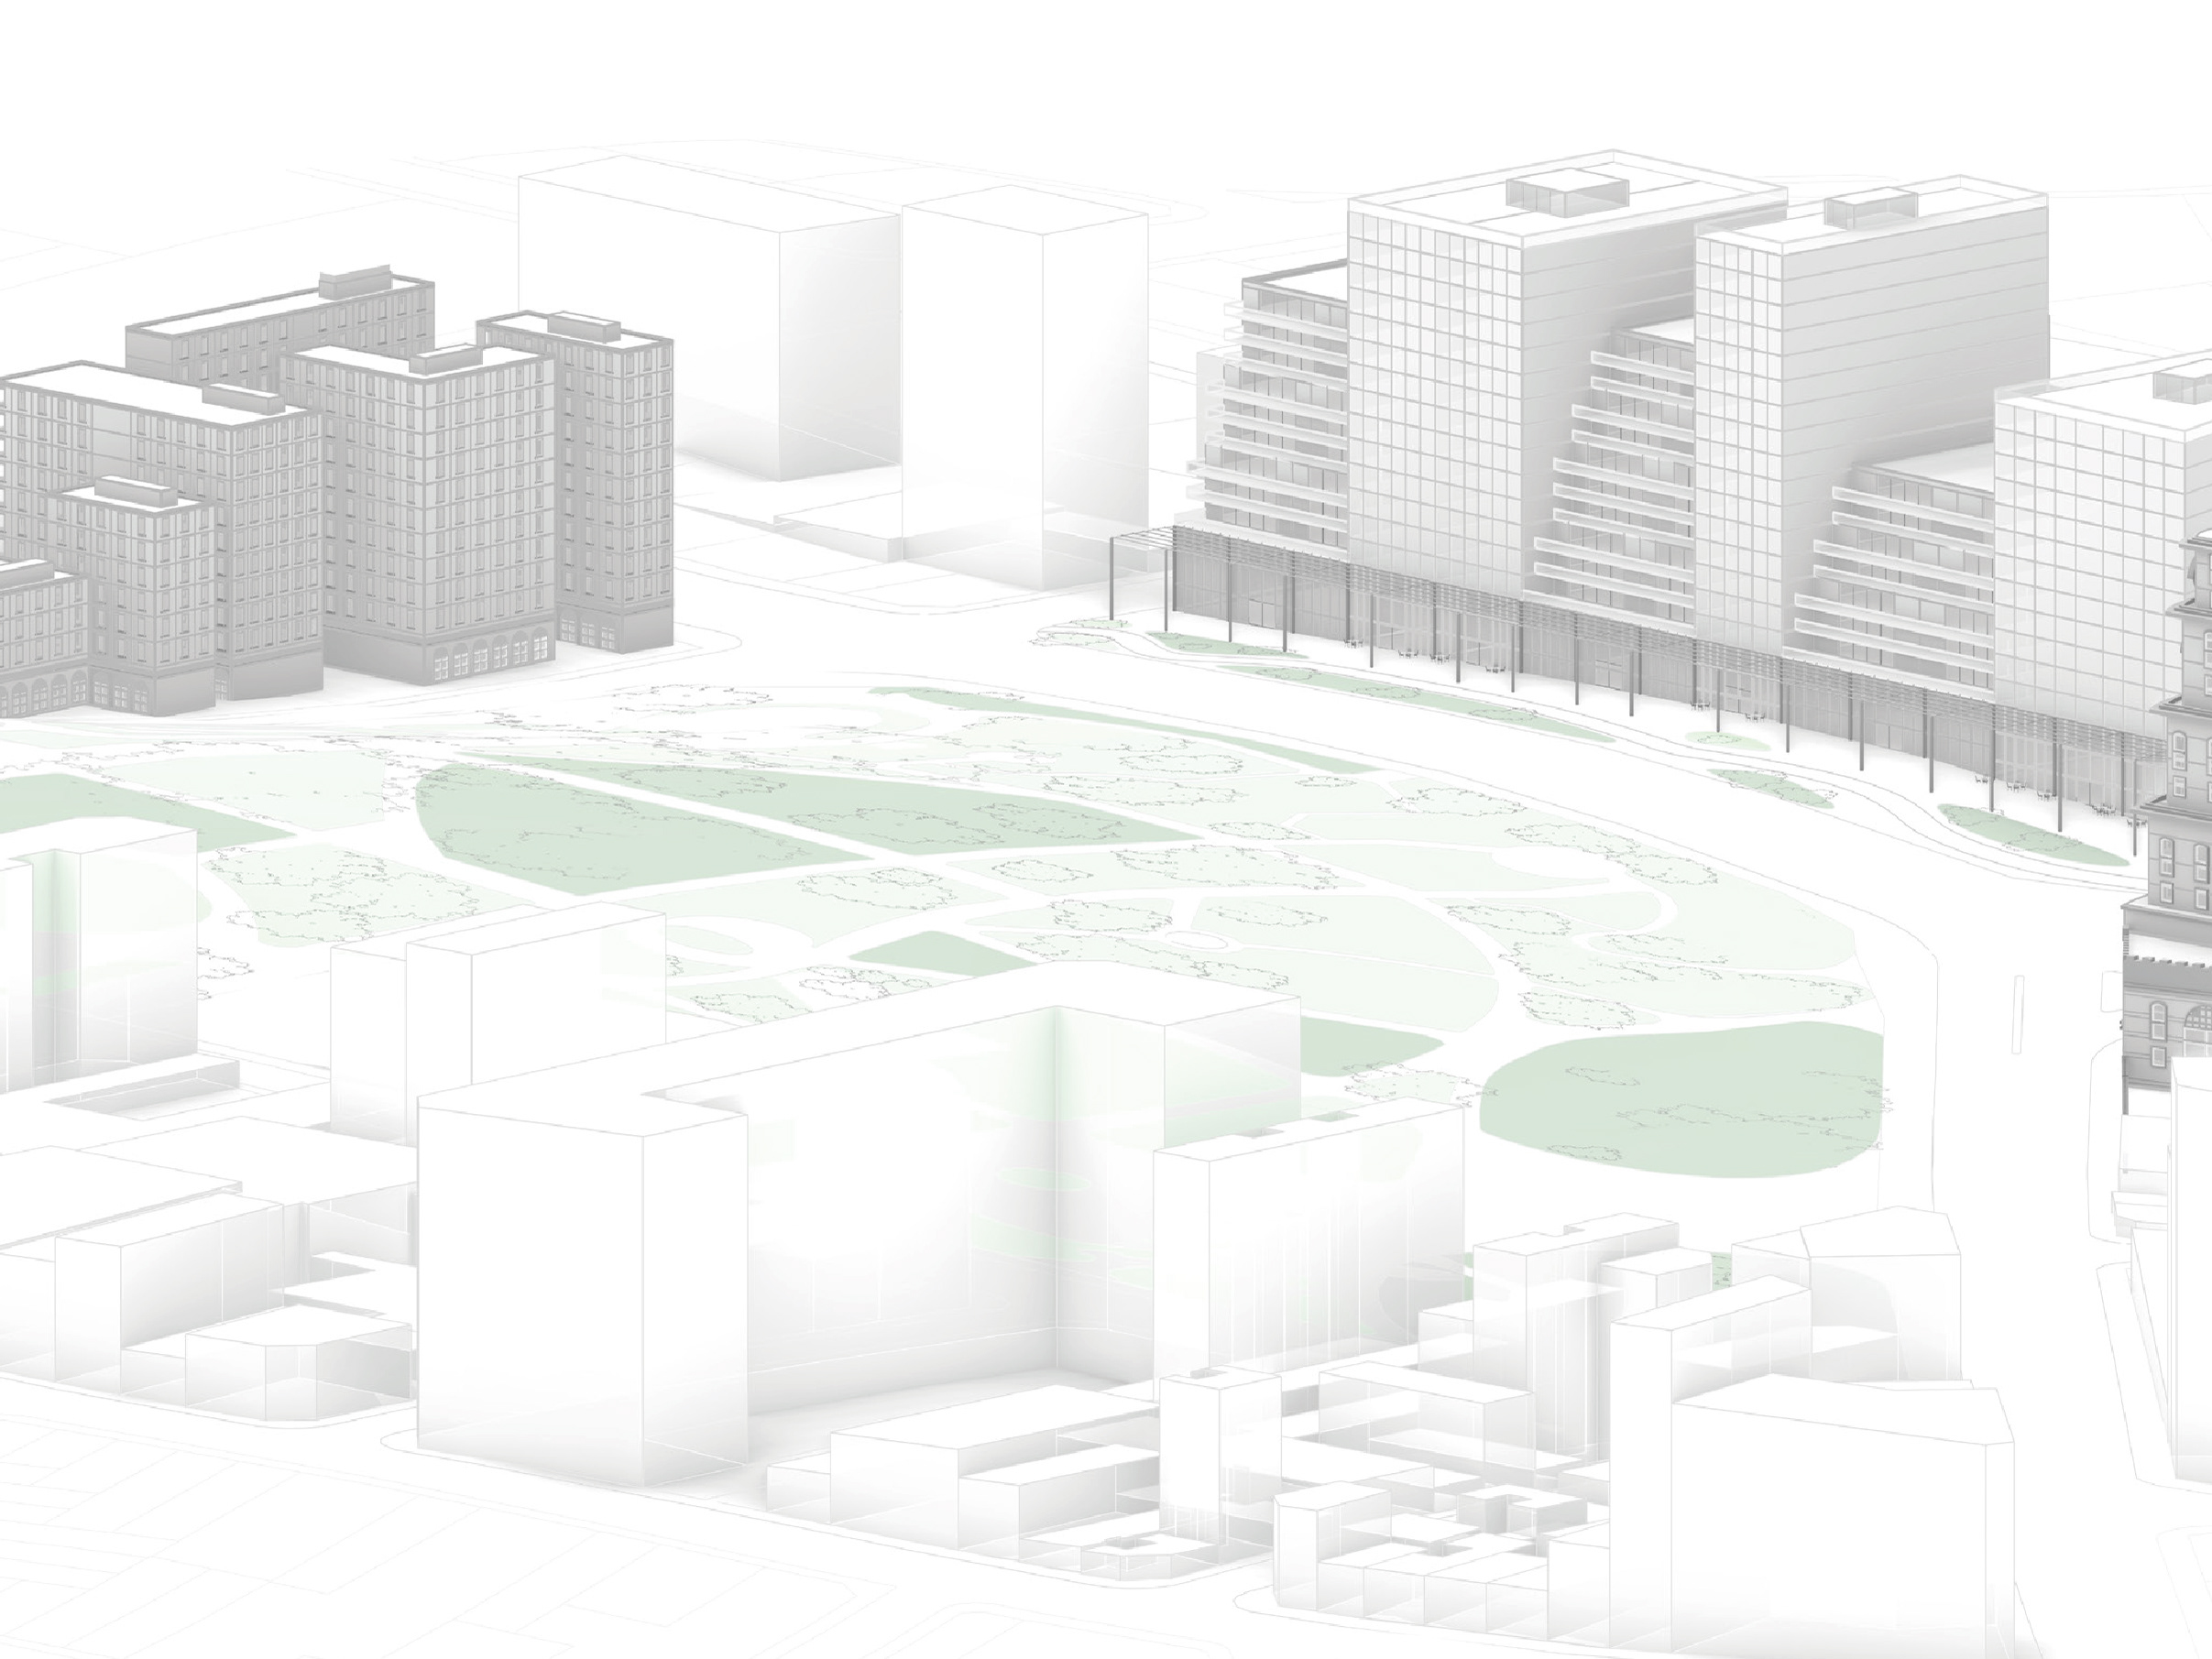
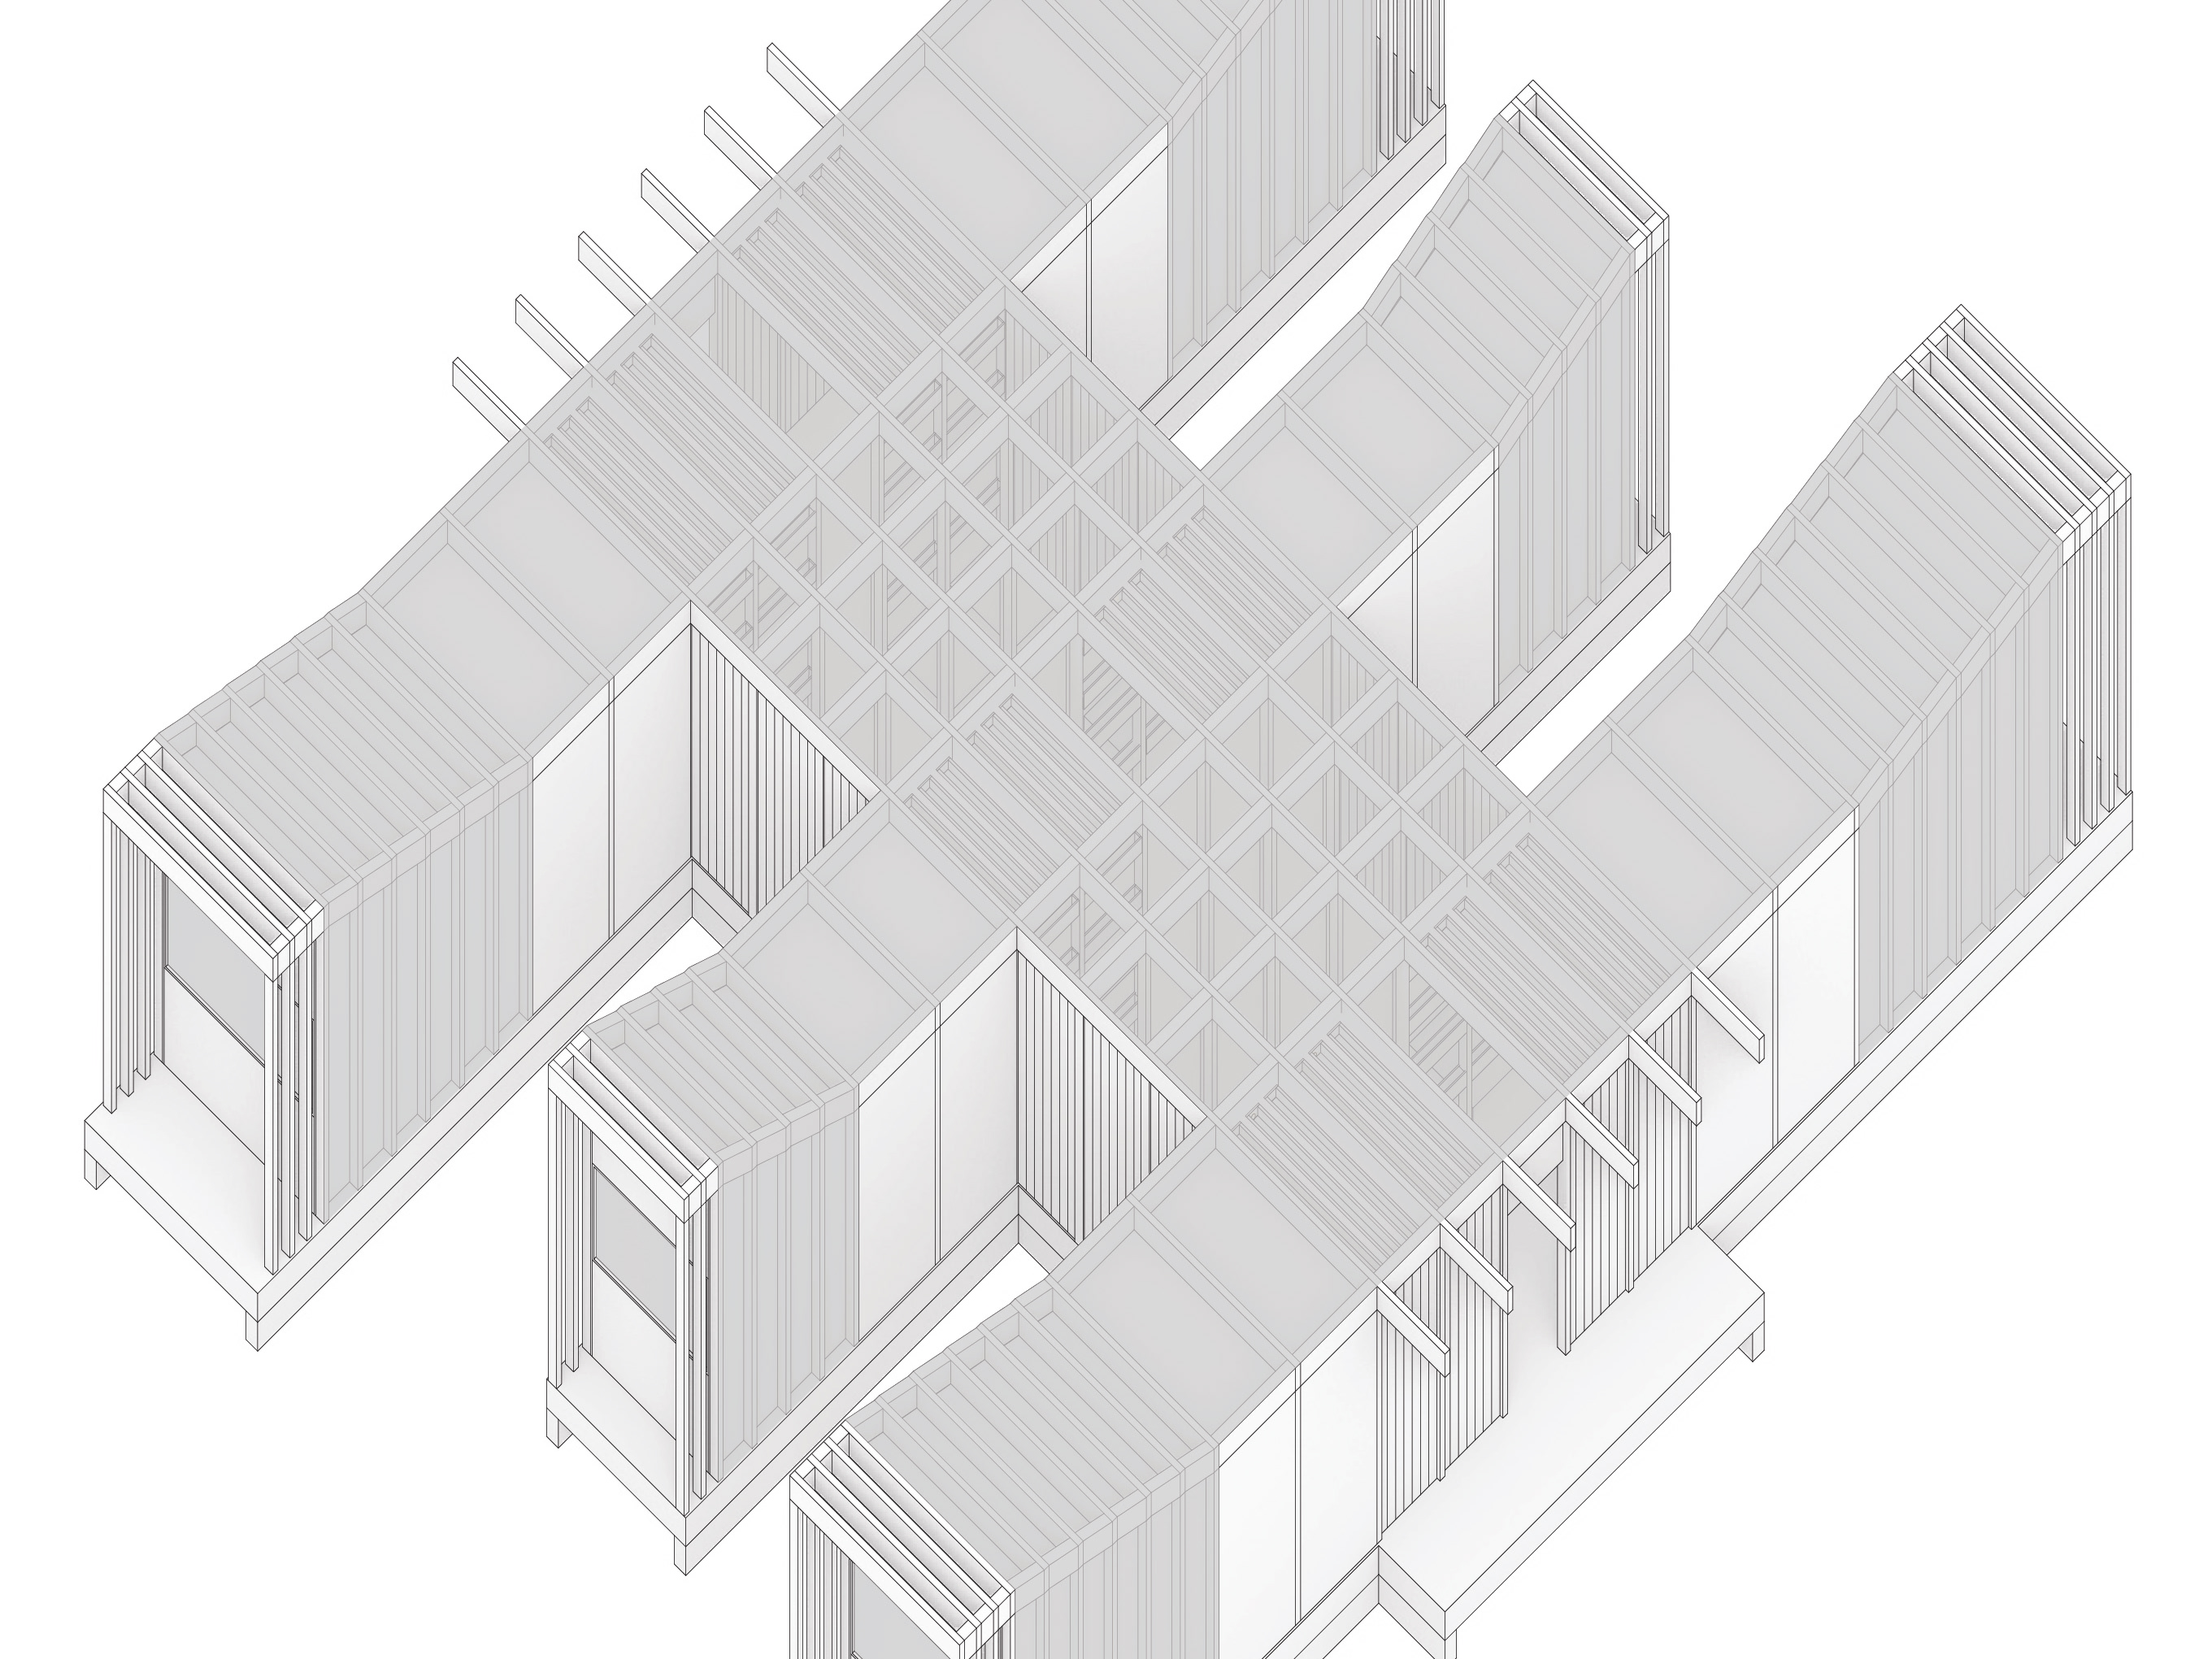
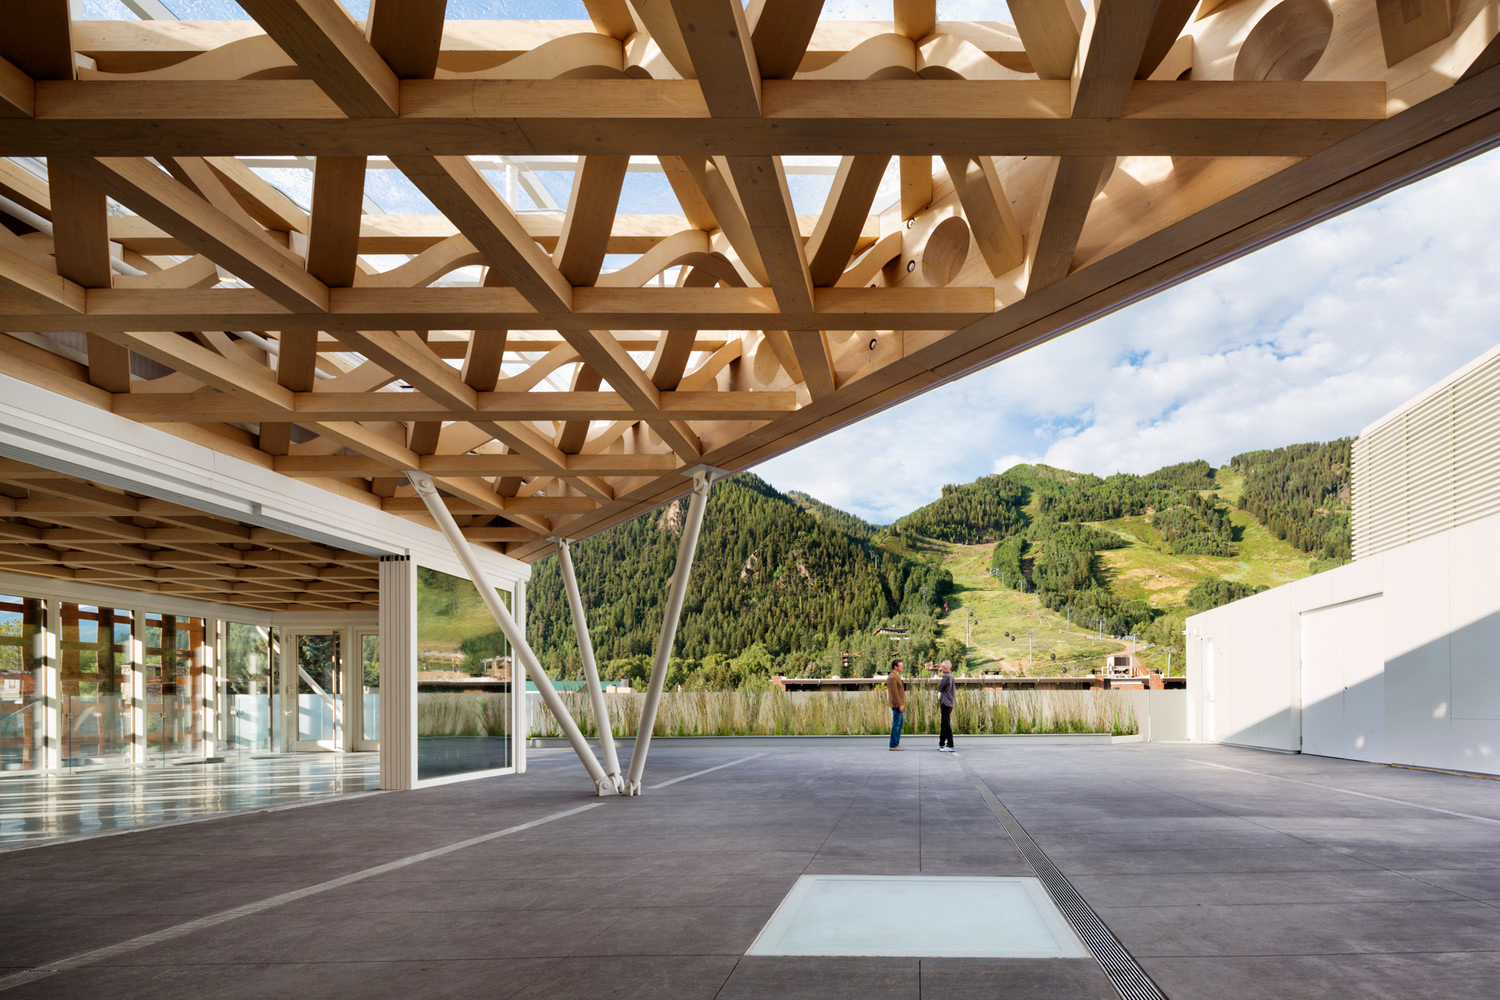
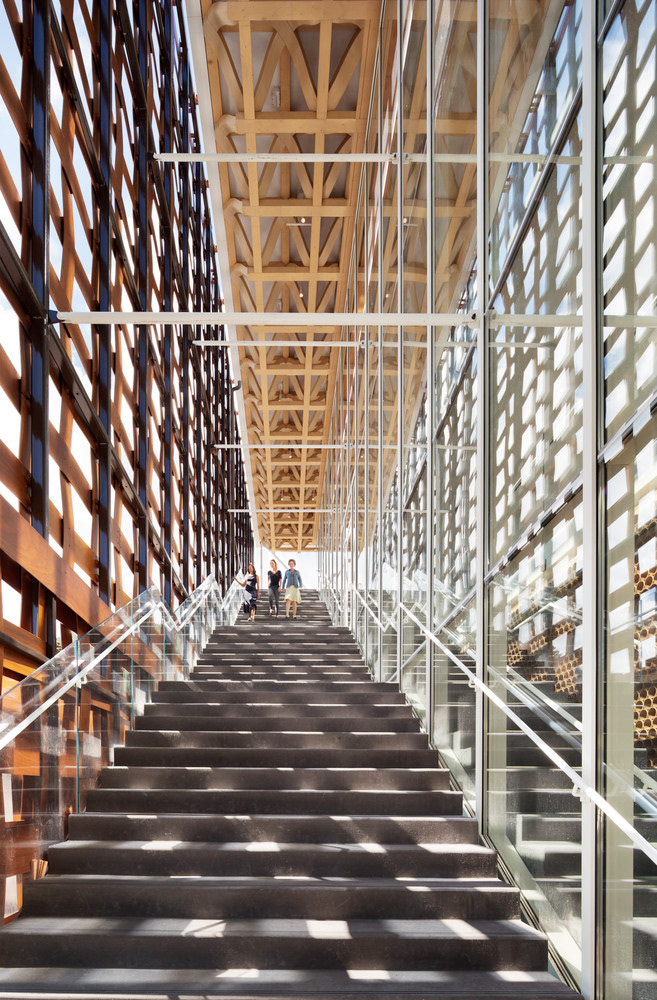
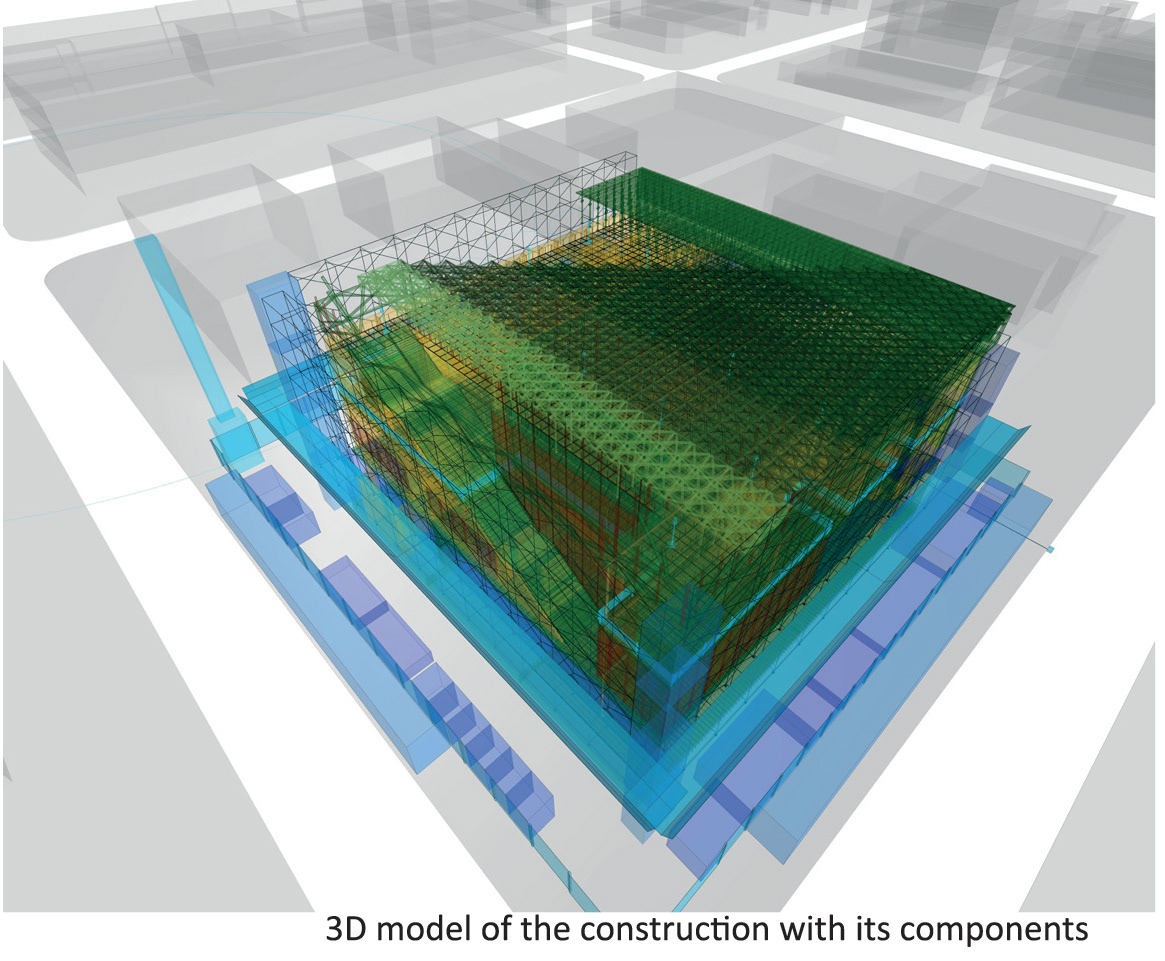
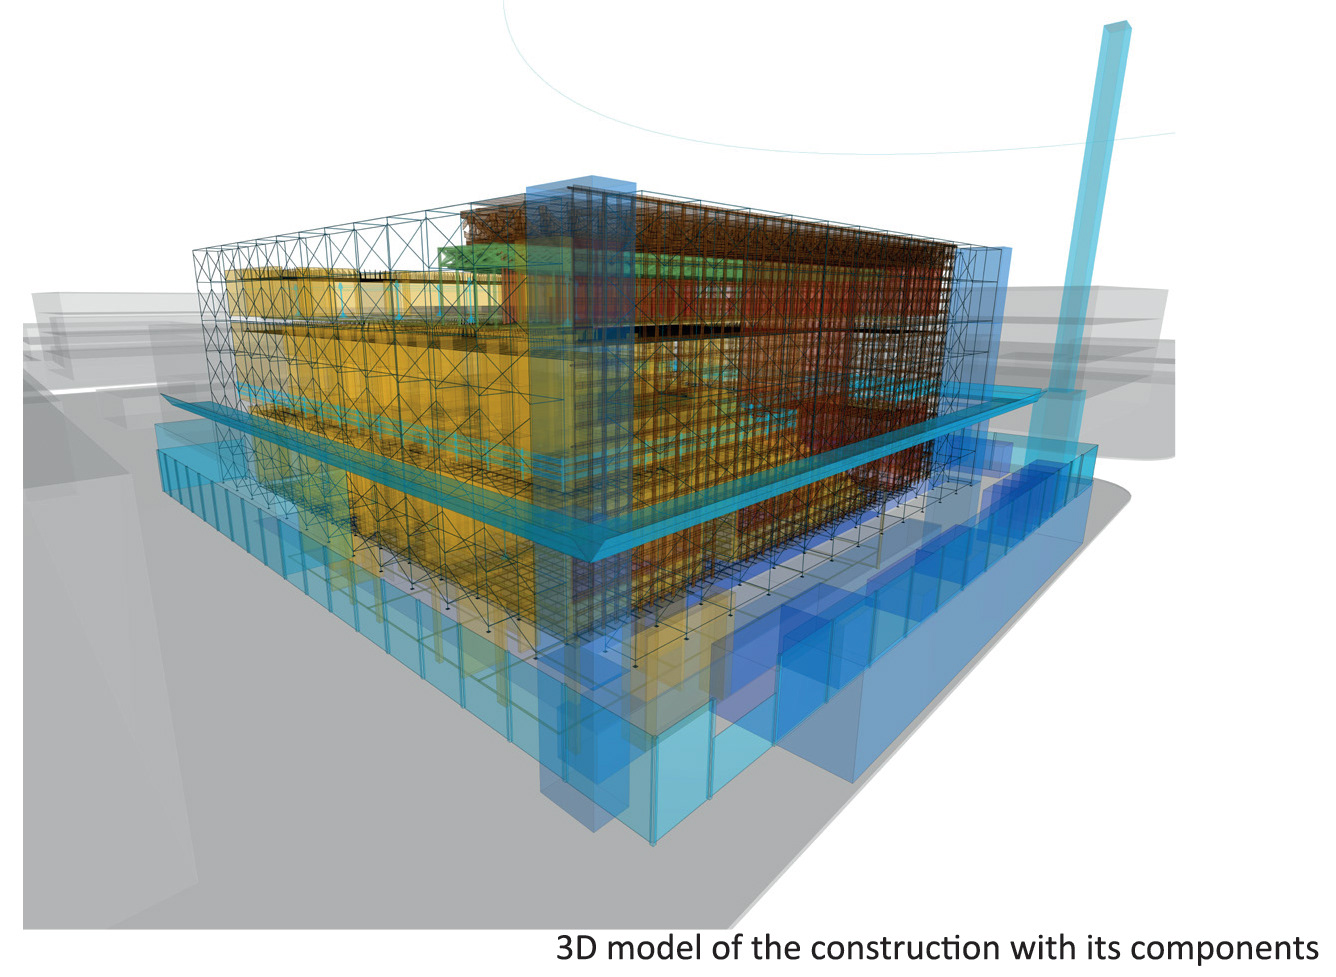
The project starts with the investigation of the Aspen Museum, designed by Shigeru Ban. It is located in Aspen, Colorado, United States. The exercise establishes, first of all, the survey of the building from which the demolition process and the step-by-step construction of it will be planned. The final objective of the subject is to be able to show, using a Gantt chart, the distribution, organization and density of tasks over a period of time, taking into consideration the particular characteristics of each project. From the diagram, and working on it in parallel, a 3D modeling of the building was made with the tasks that coexisted day by day. The project will be developed in 245 days, therefore, there are 245 models with the tasks to be carried out day by day. This is useful for the design of the Gantt chart, both to ensure that there are no overlaps of two tasks that are not compatible, to be able to vary the position of the workshop if necessary, and to be able to vary the horizontal circulations or positions of the machinery for its best performance. It can also be verified that the sectors of each task do not overlap, the latter is calculated according to the number of workers per task, and from that the number of workers per M2, each task having then an area of surface use by the workers who do it.

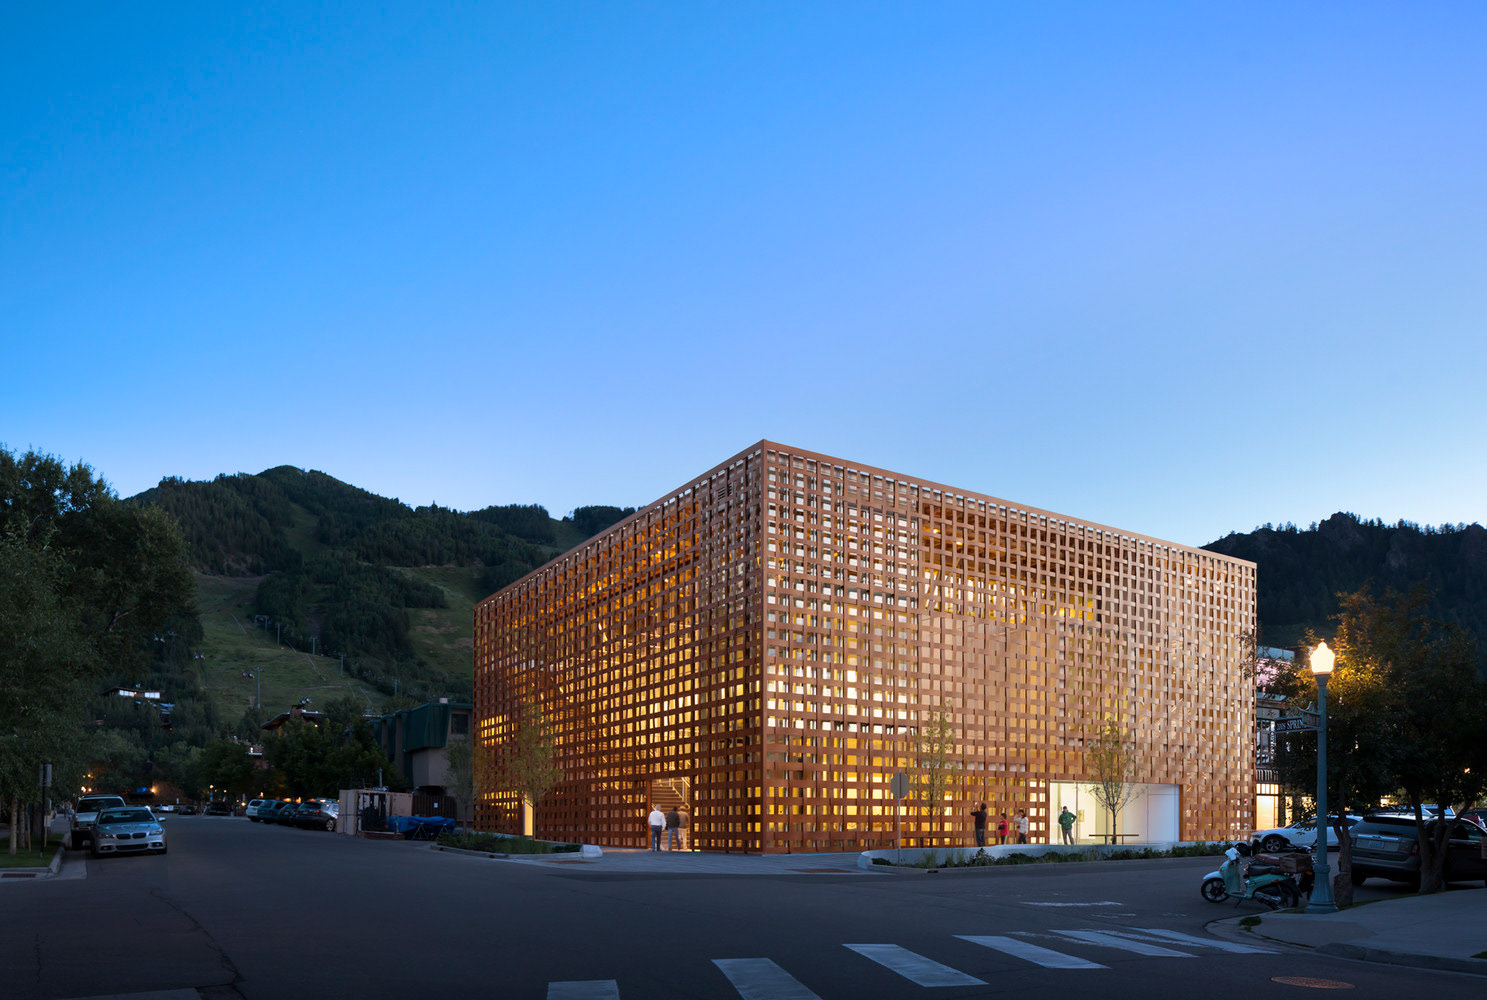
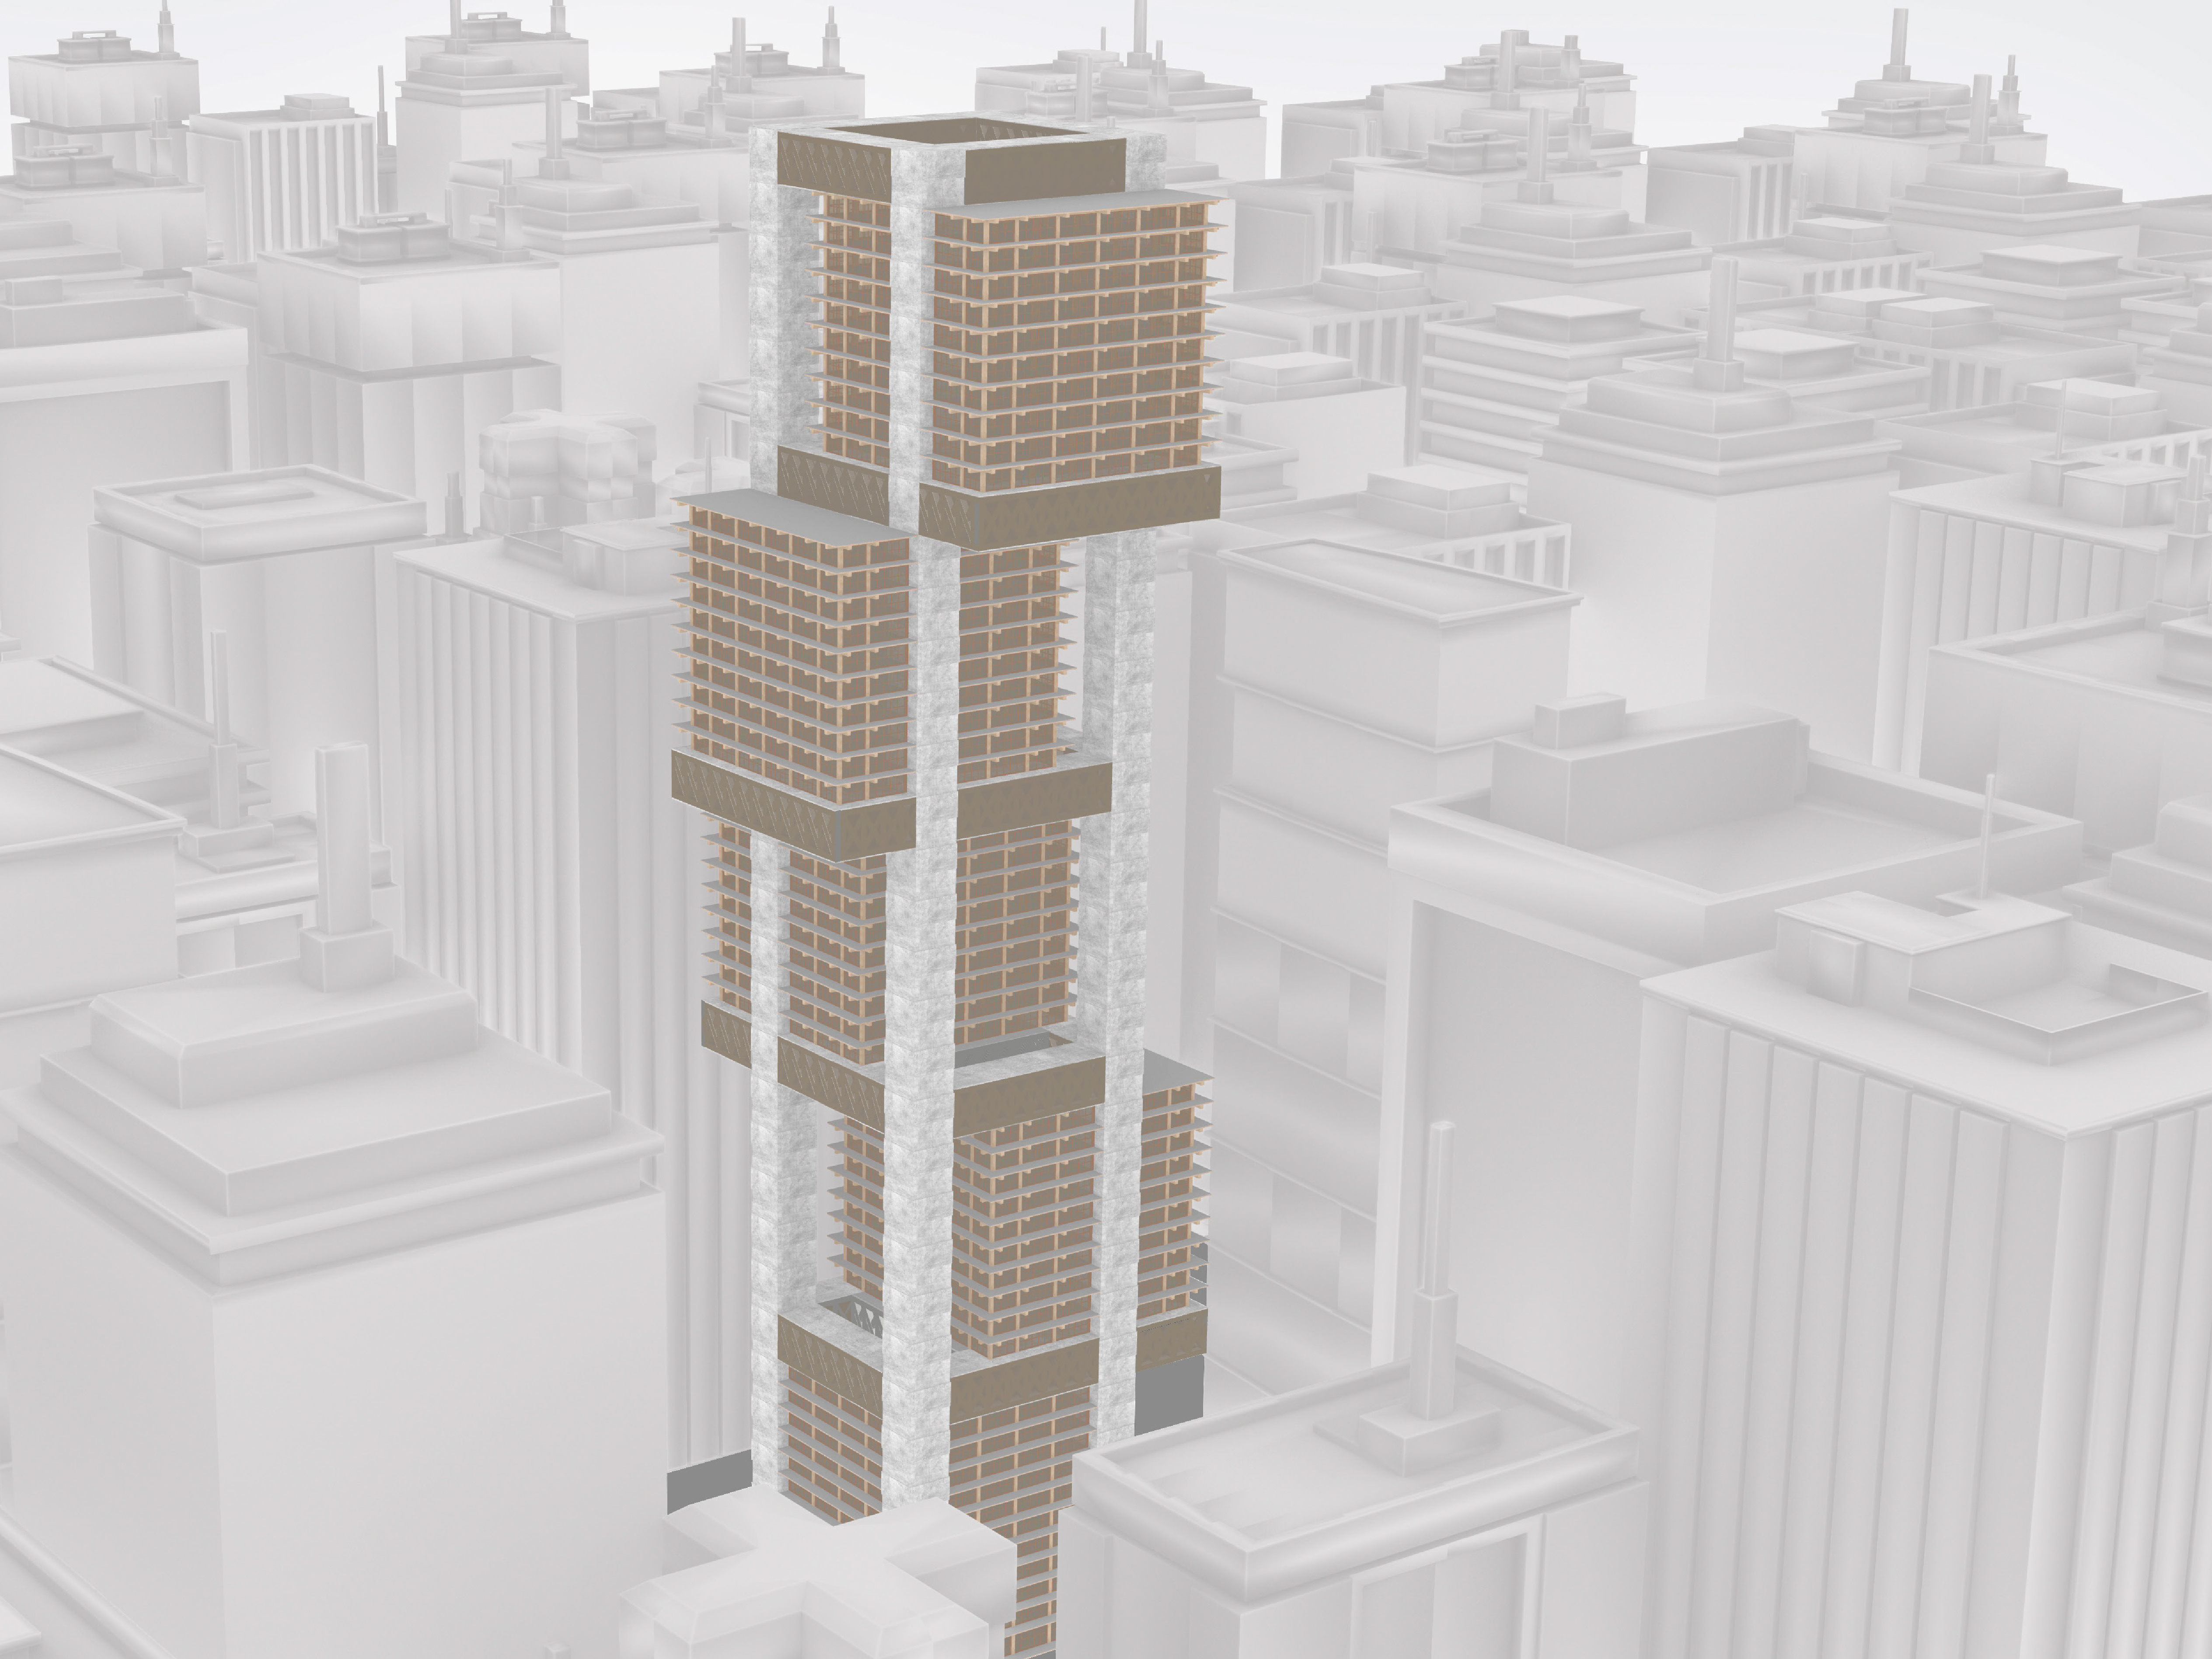
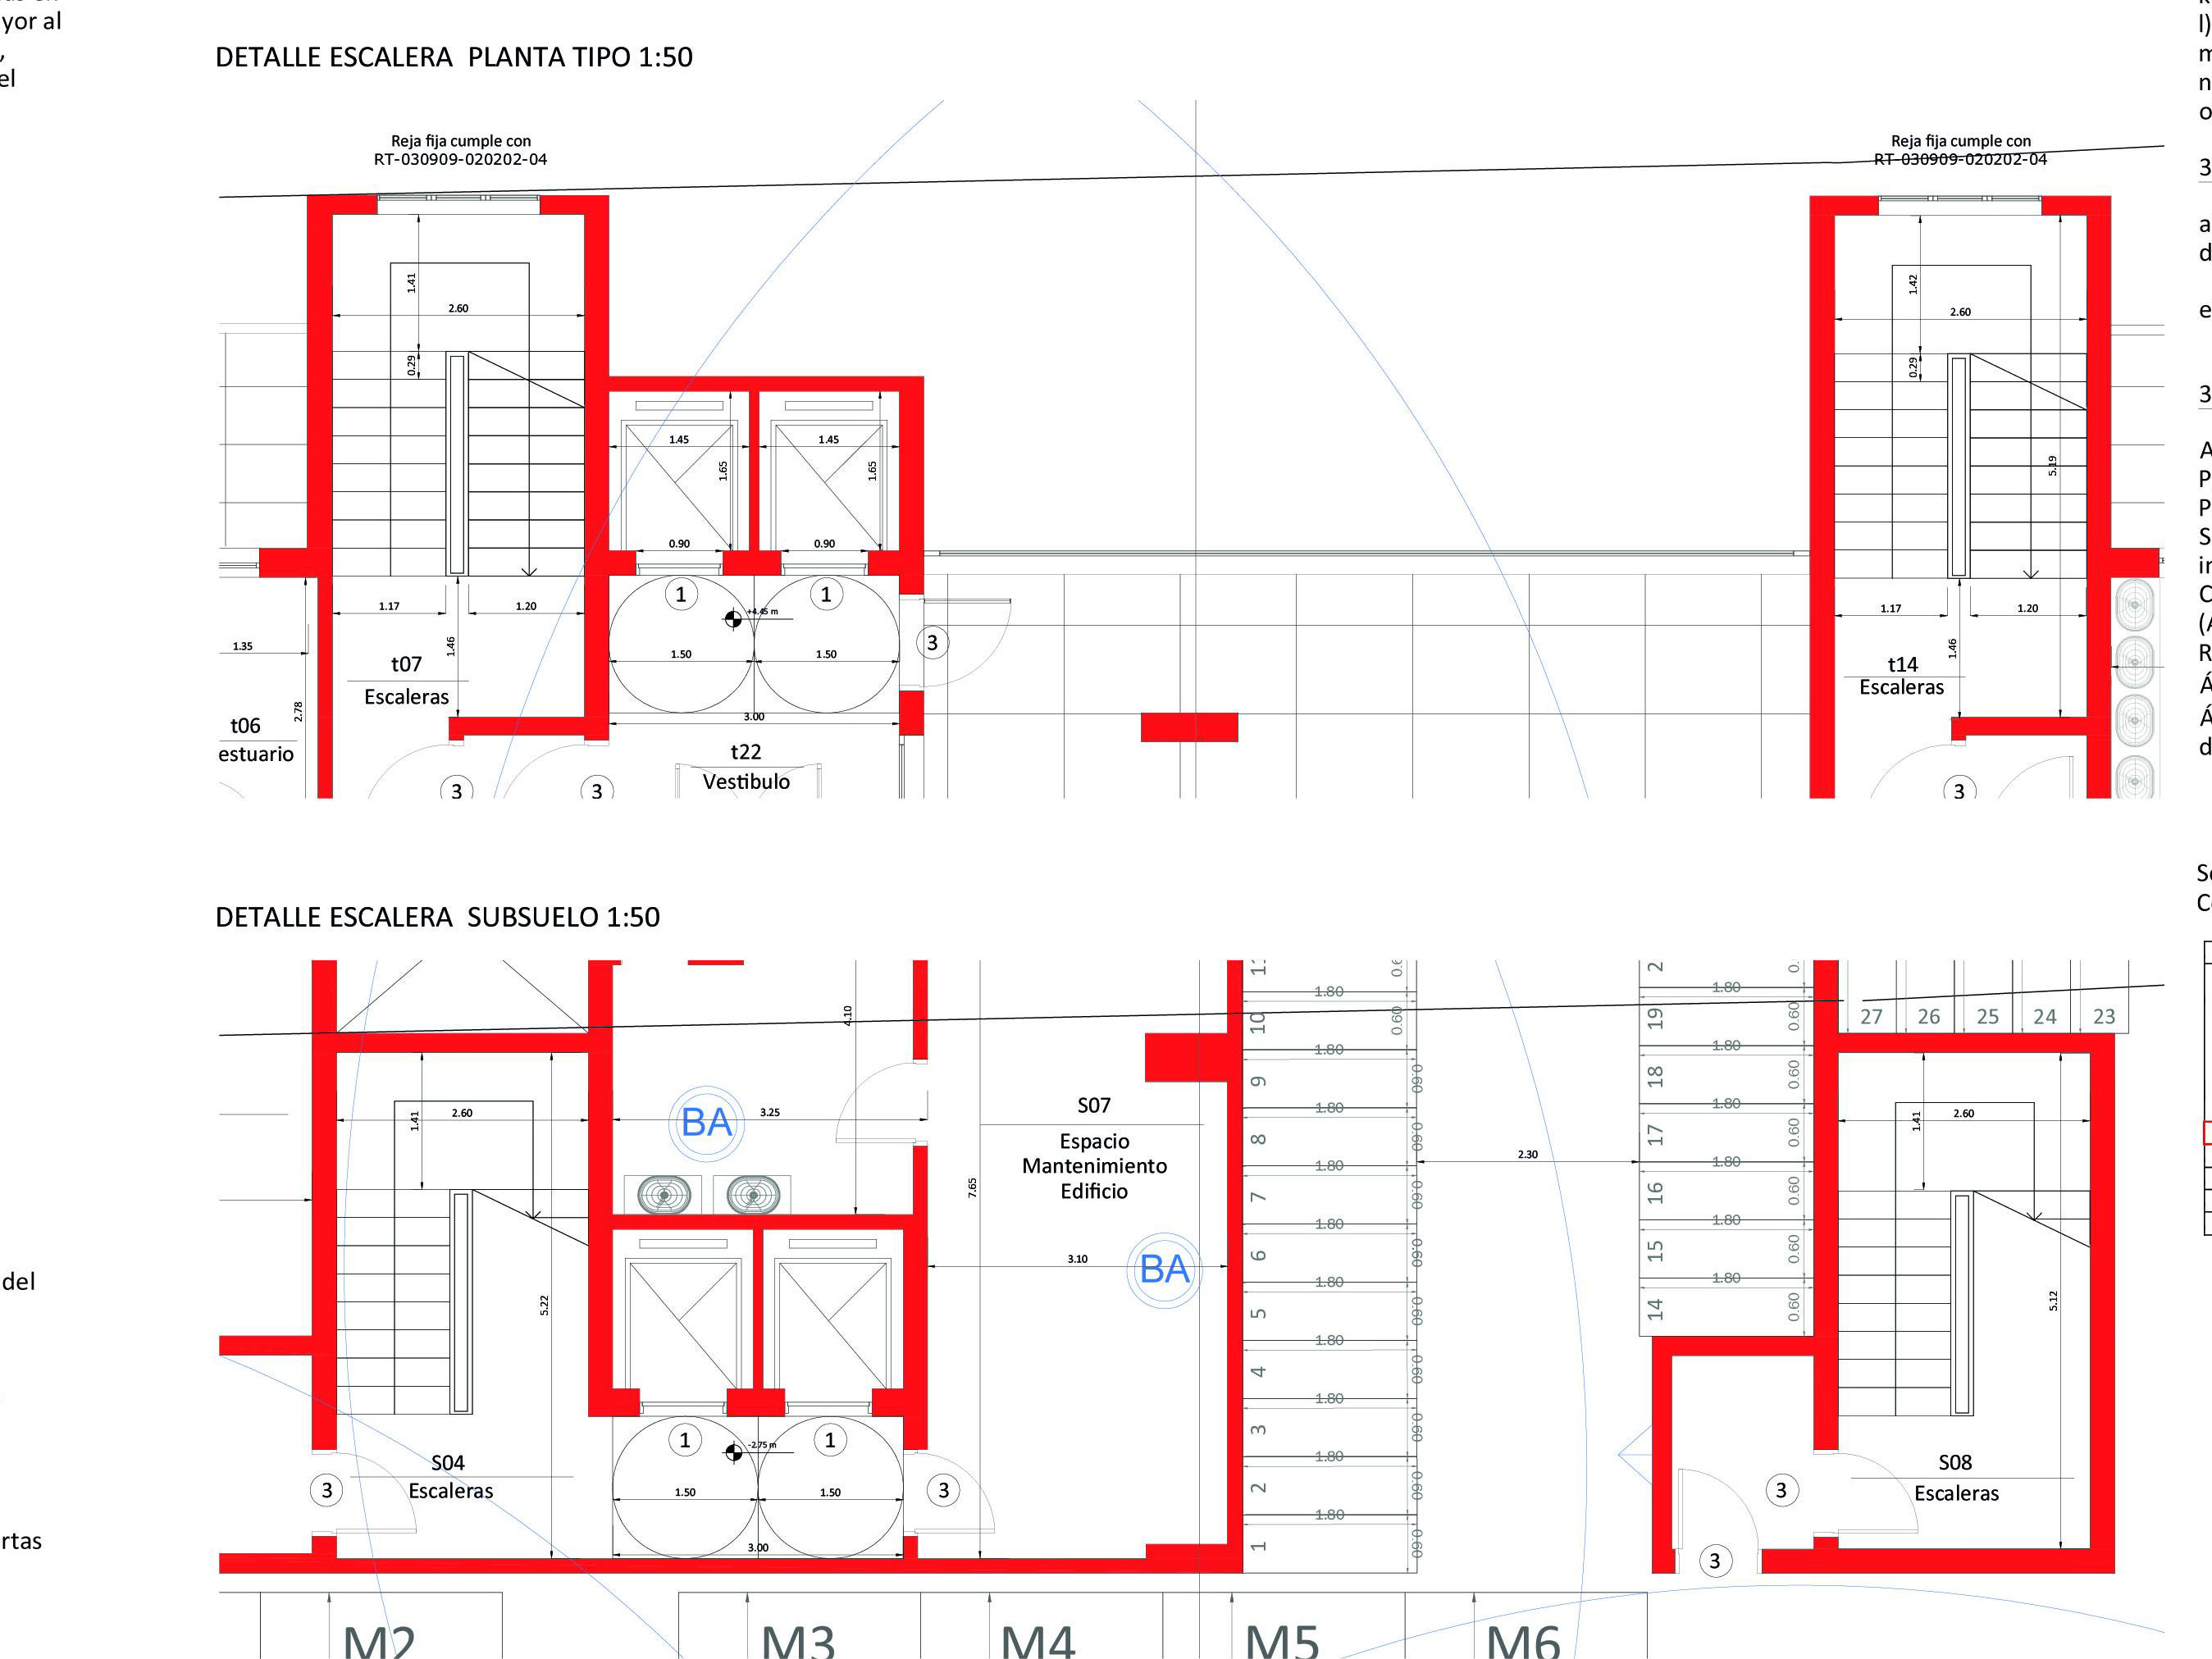
In the case of the Aspen museum, certain climatic issues have been taken into account, such as snow seasons, where certain processes are stopped, or even the peak seasons in the area, where the progress of works is prohibited for two weeks due to turism issues. This is why the decision is made to start the construction at the end of the peak season, so that it falls again one year after the construction began, and internal tasks can be carried out in the following snow season. Another characteristic of this project is that it makes use of many prefabricated parts, such as the facade or the interior walls, so these tasks will be the last to be carried out. It is also decided that the electrical, sanitary, ventilation and ceiling tasks will be carried out floor by floor and not once all the plants have been completed, so the moments of the work in which the concrete setting occurs, are used to perform tasks of facilities.
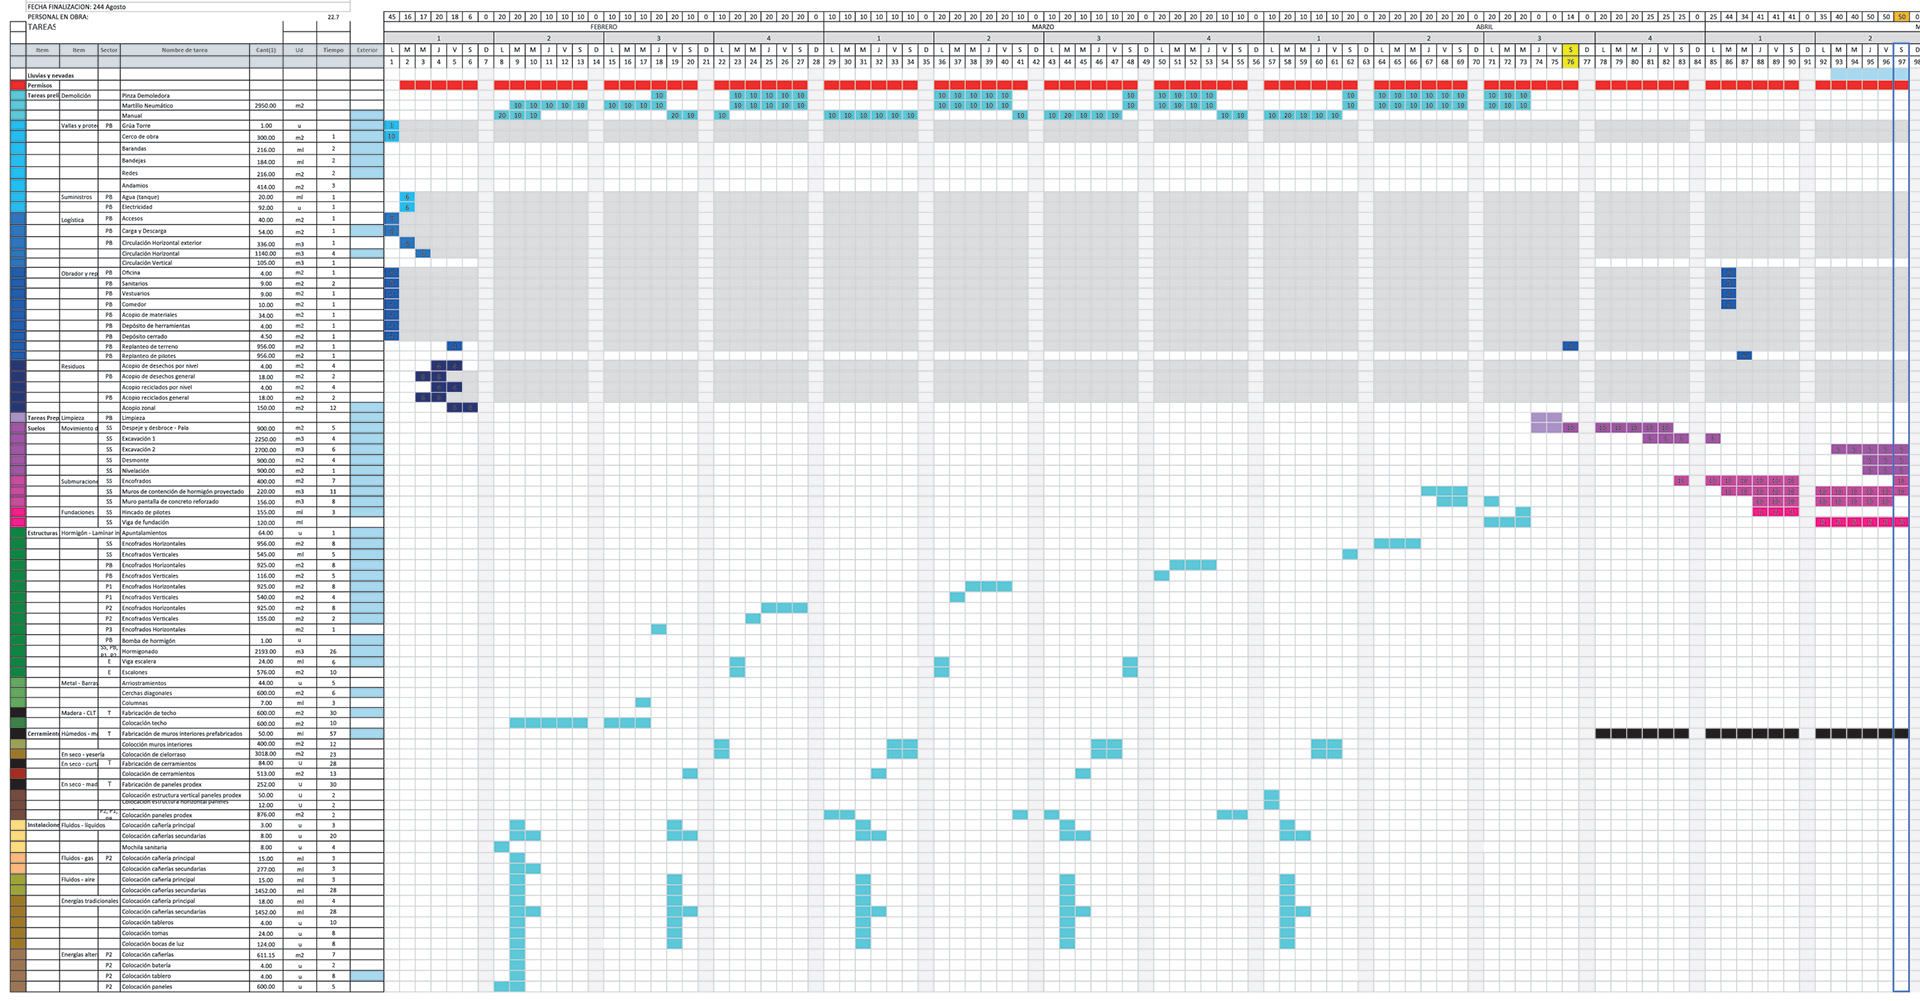
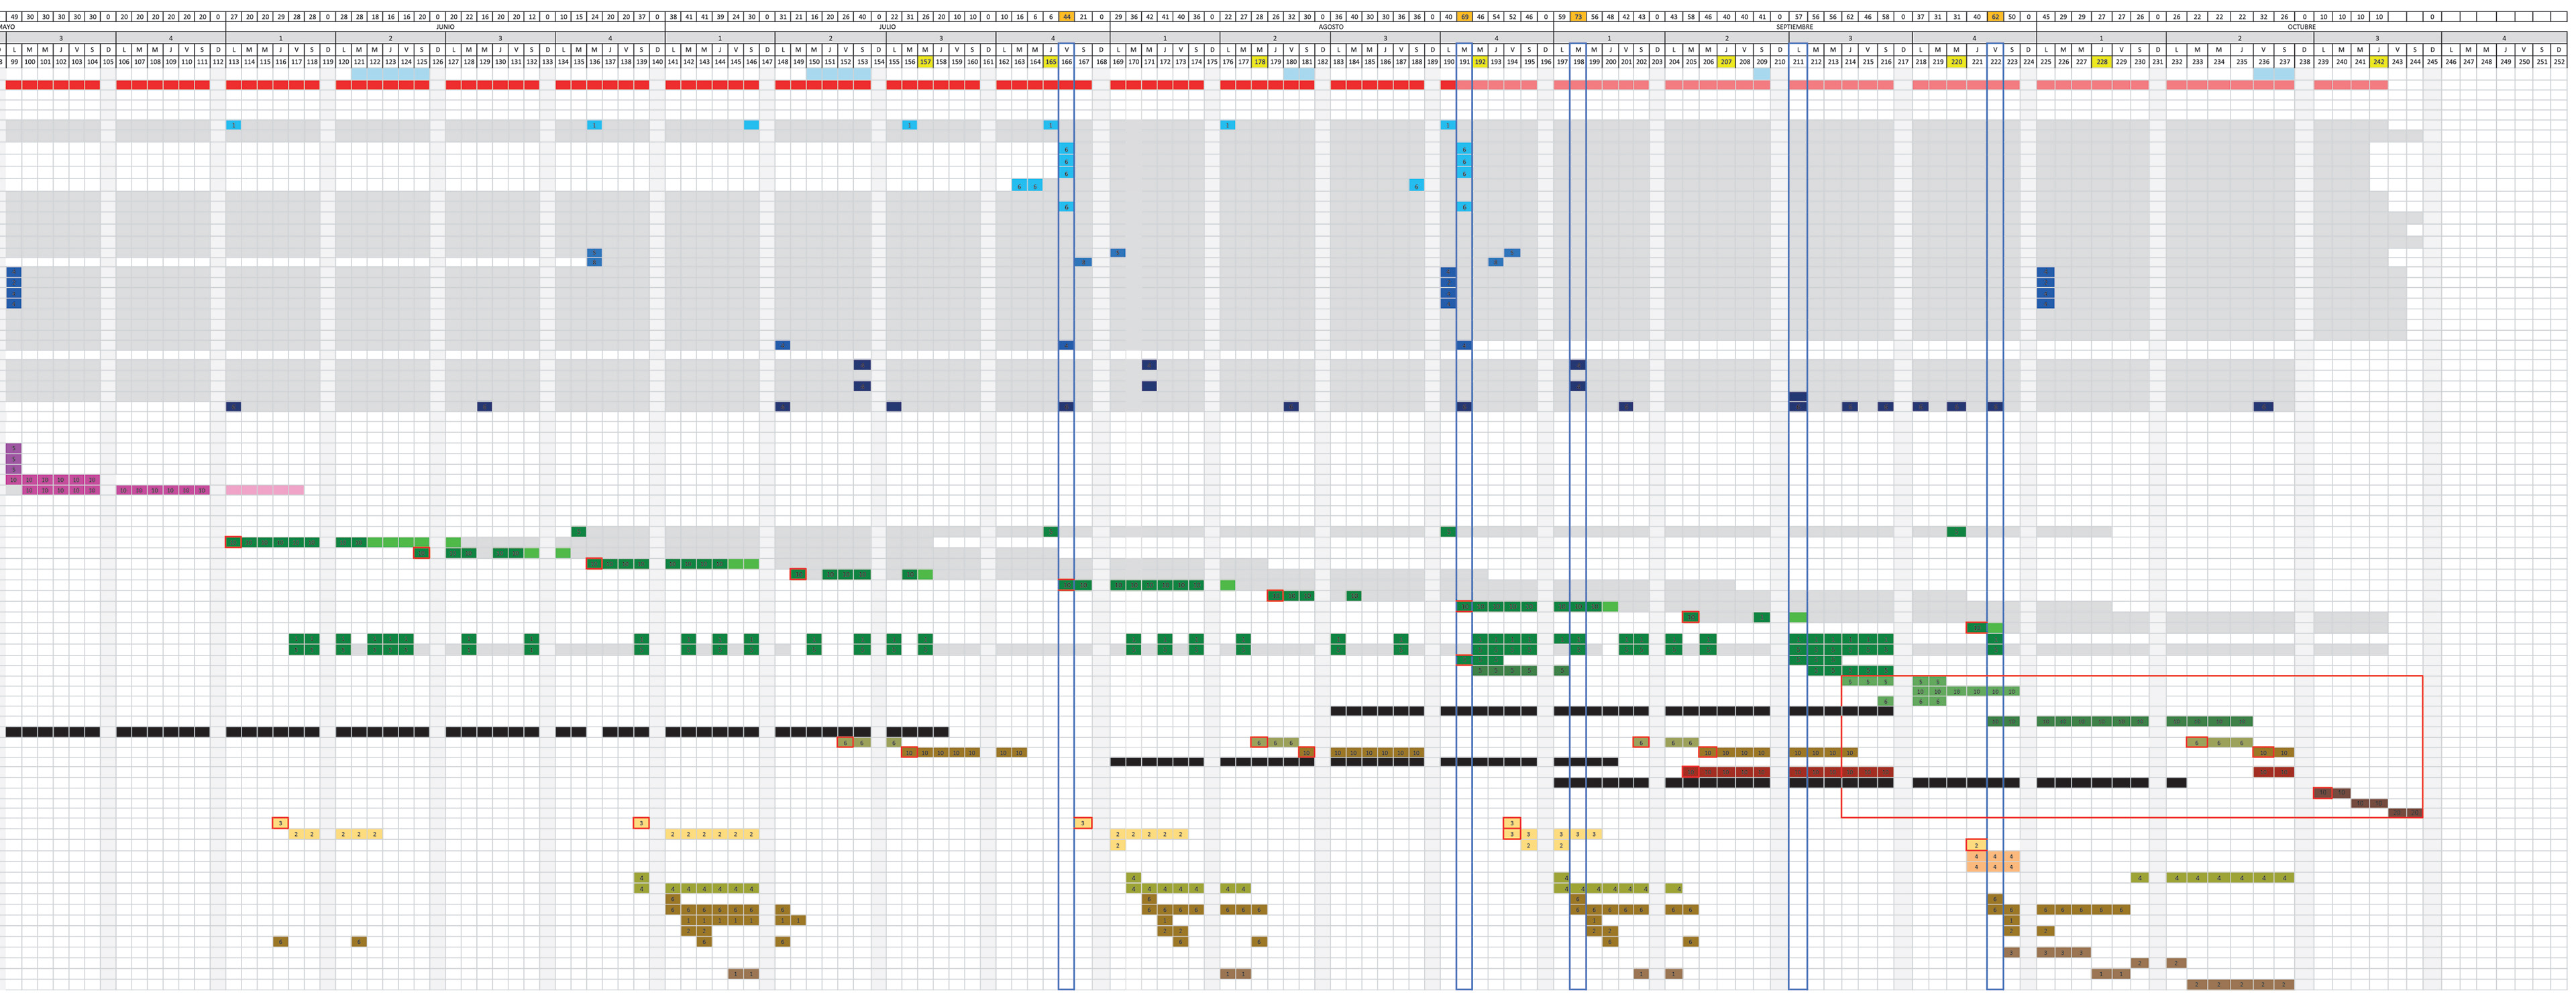

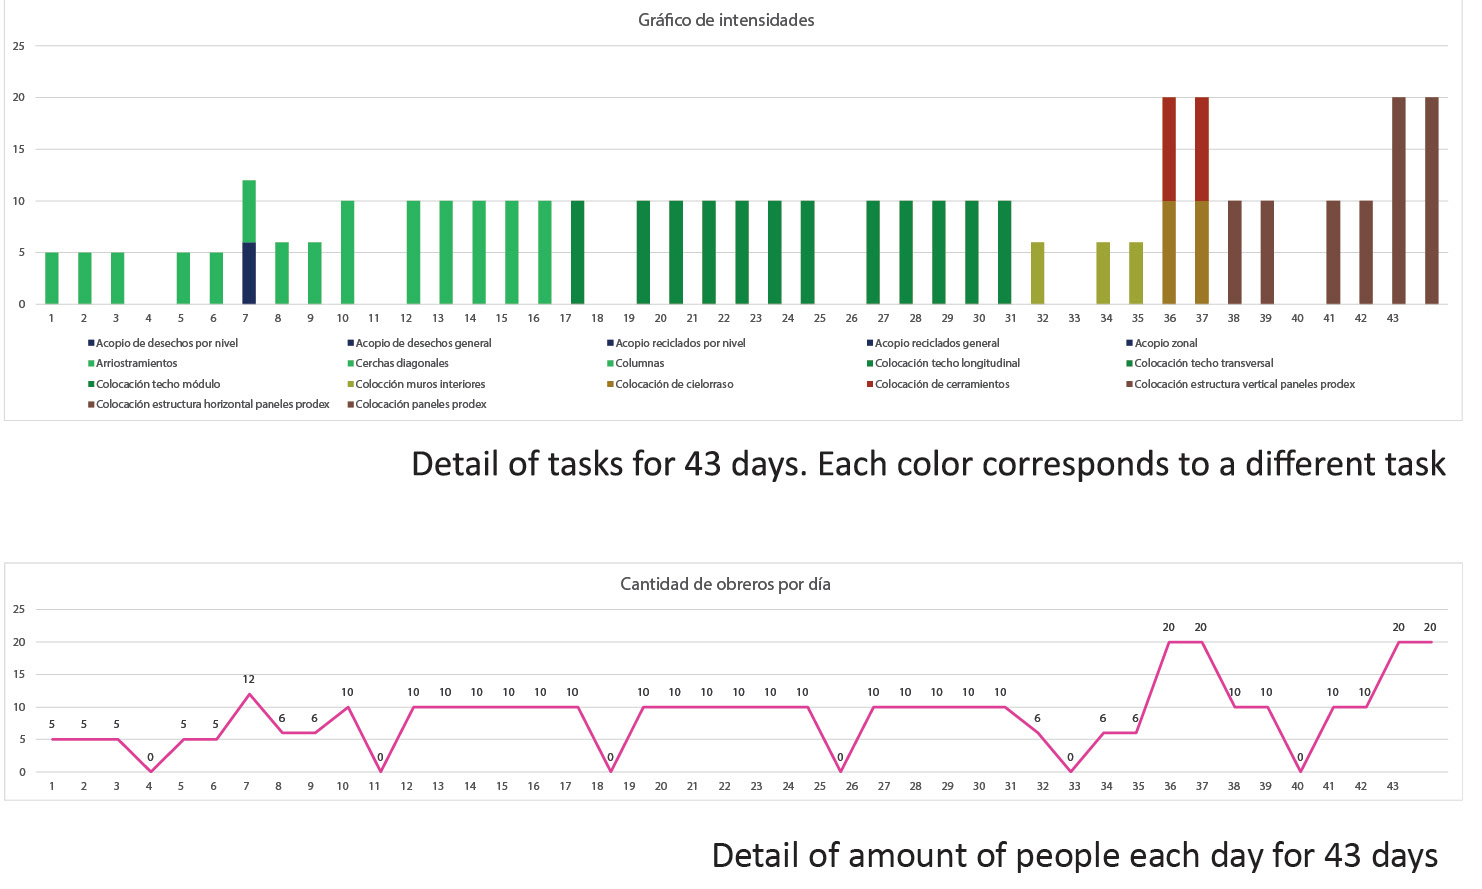
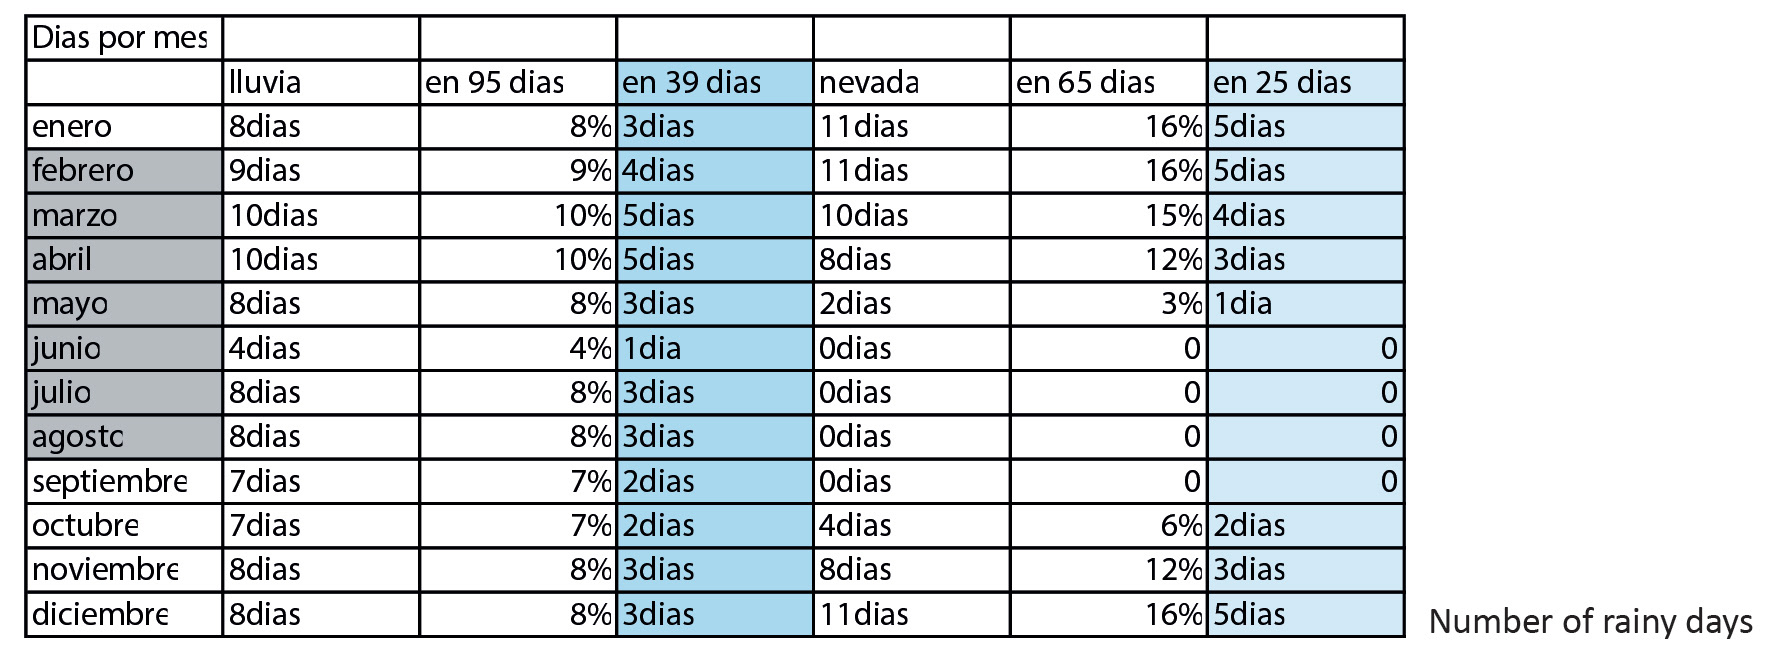
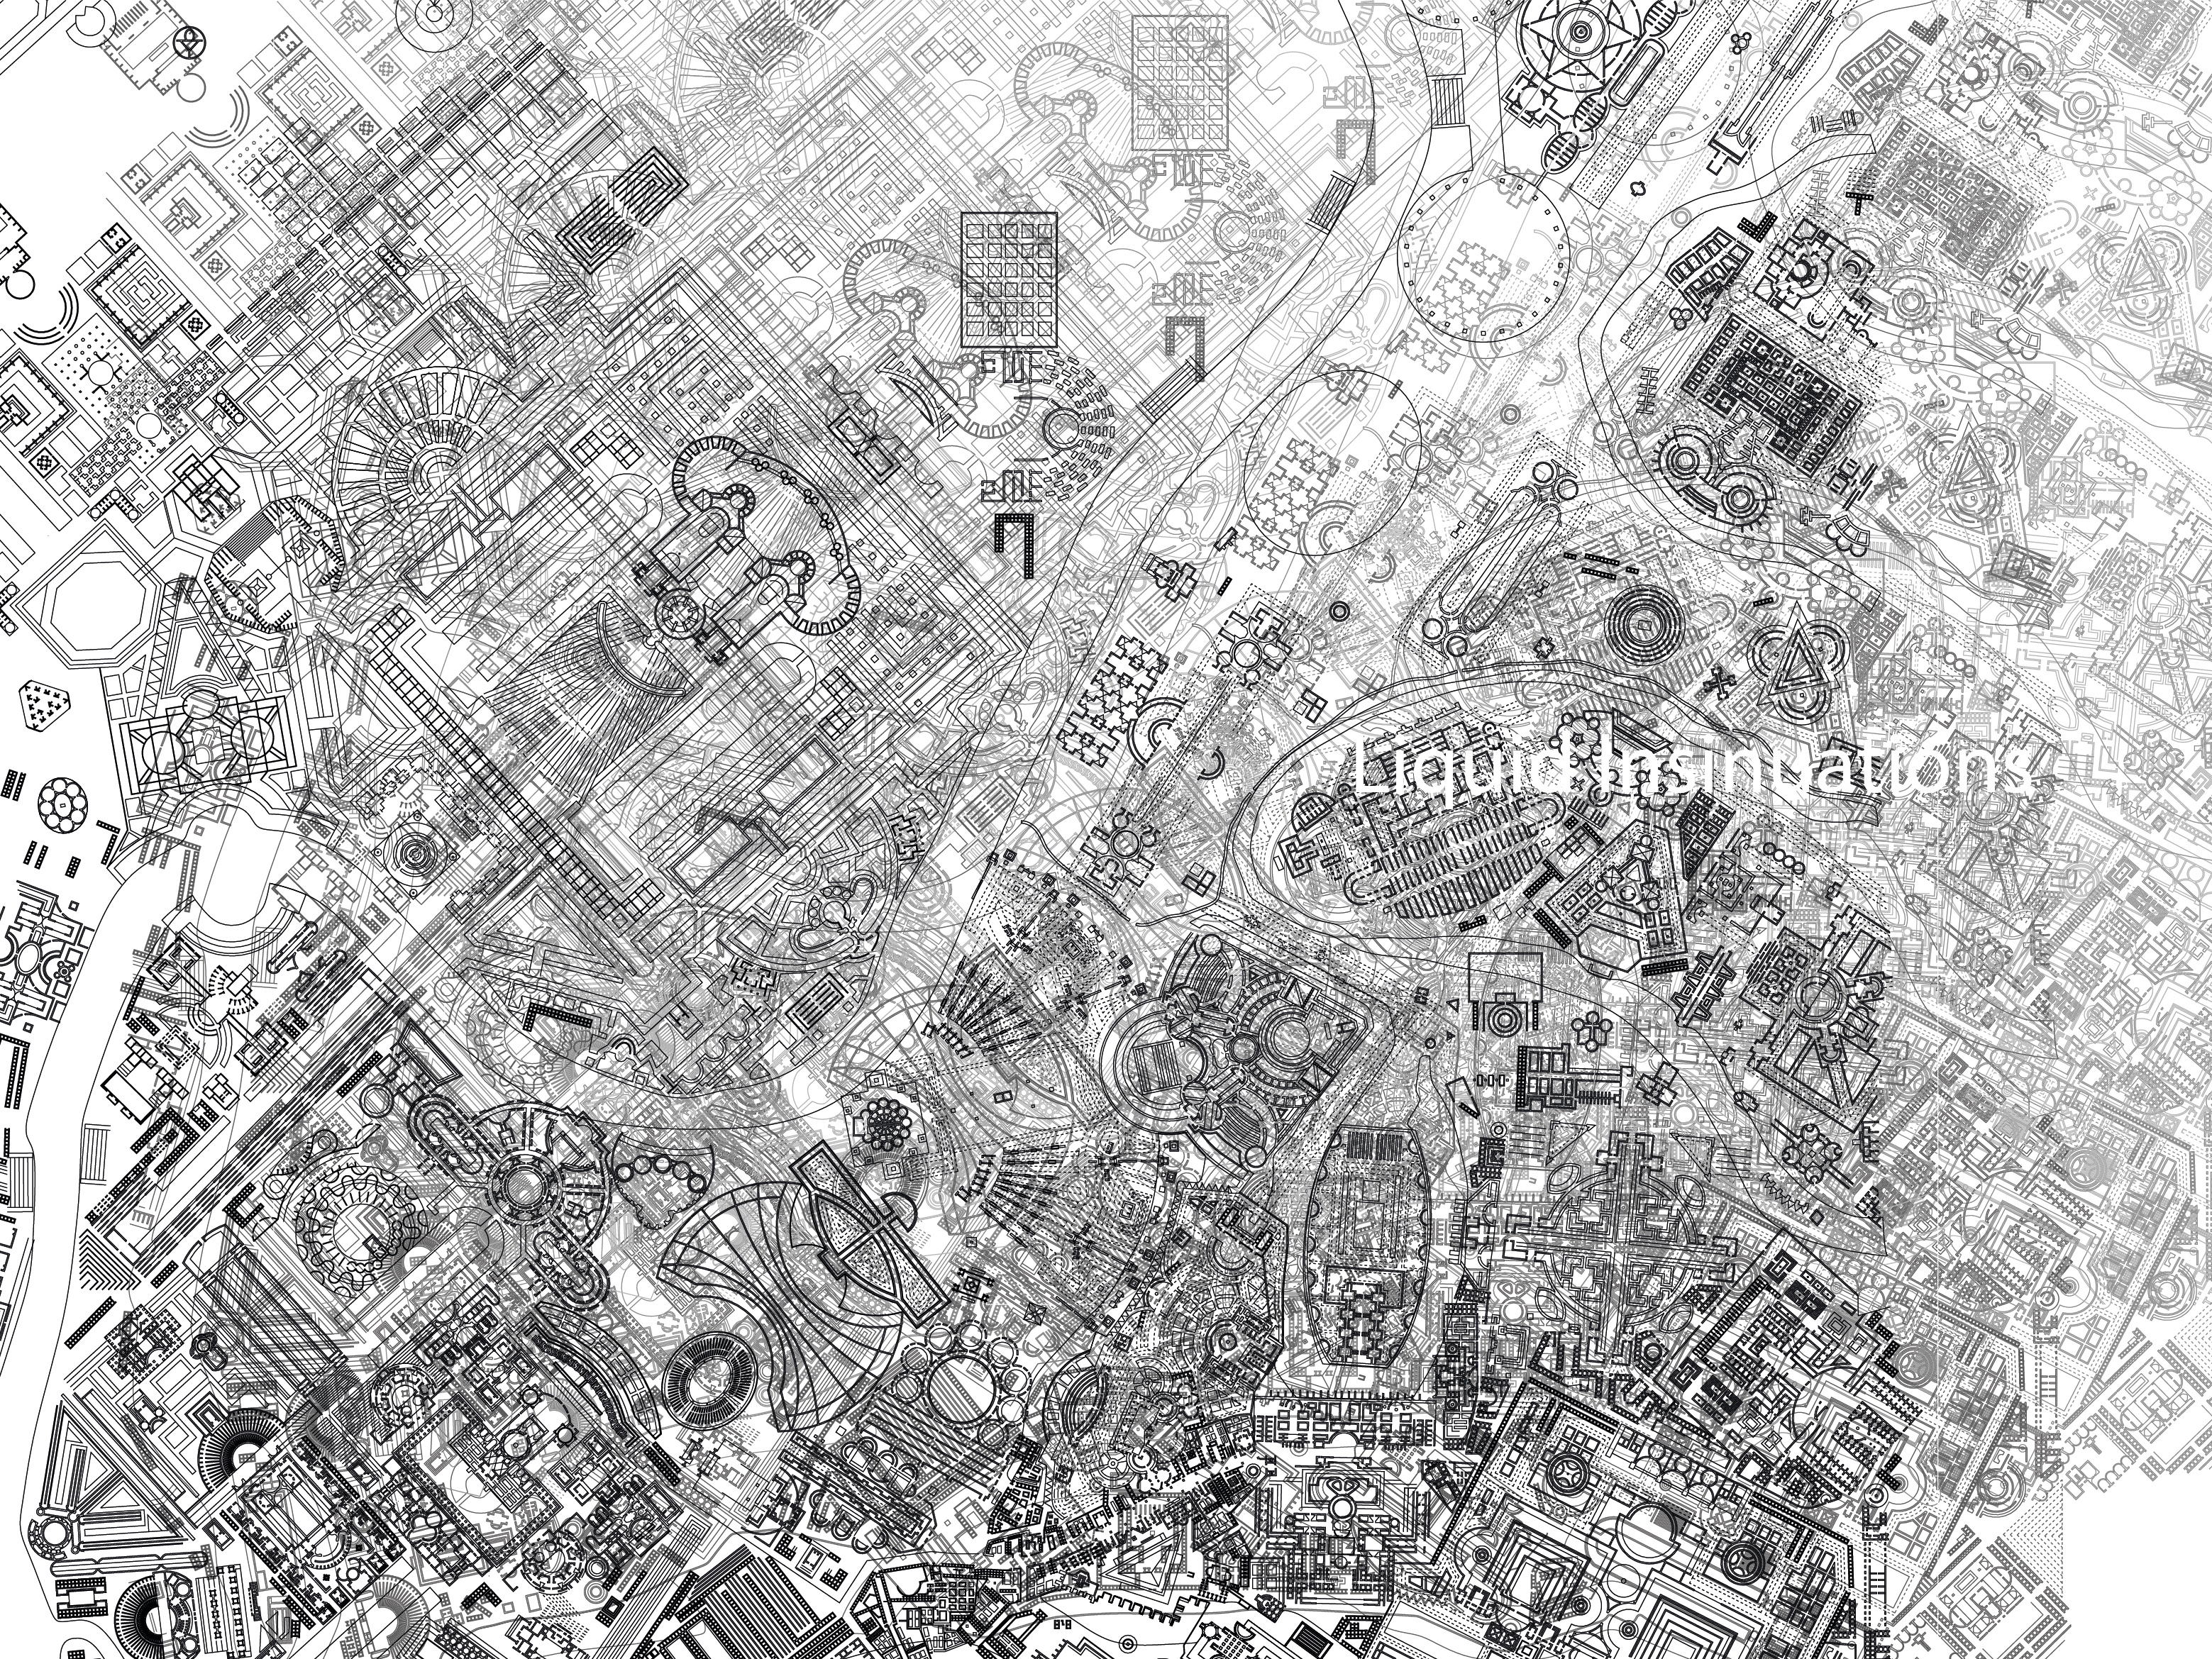
It is intended that the construction progresses as quickly as possible, therefore, once the lower slab is filled, after two days certain activities begin on top of it, to take advantage of the time and be able to concrete the next one in the shortest possible time. Certain graphs are also used that allow a better distribution of the tasks on site, such as, for example, number of people per task, and per day on site. In this way, it seeks to distribute the tasks so that there is always a consistent number of people on site, and minimize peak days, since economically it is not very consistent to vary the number of workers per day much. Another consideration that is taken is the number of rainy days per month, in order to plan days in which the work lost due to the presence of rain would be recovered, such as concreting, and not delaying all the work.
With the help of these charts and with the parallel modeling of the day-to-day activities, is how the final Gantt chart was generated. It was not a last resort, but was corrected and updated as information from the graphs was incorporated. Both the graphs, the modeling and the Gantt Chart, were parallel processes that provided feedback to respond to each other, in order to find which is the most efficient arrangement of tasks for the whole construction.